All opinions expressed here are our own and do not necessarily reflect those of Bank of Finland or the Eurosystem.
Abstract
Now, as inflation numbers appear to be returning to pre-2021 levels, an obvious question is whether the low-inflation regime will be permanent and whether the nature of inflation will remain similar to the previous low-inflation period. Our analyses with EU cross-country data and Euro area microdata suggest that although the dispersion measures have come down, the change rates have not yet fully normalized.
It is well-known that the rate of inflation has decreased, but rates remain above the near-zero levels that prevailed until the Covid-19 pandemic. It is somewhat surprising that the cross-country dispersion of inflation has also decreased, and even more rapidly than the rate of inflation itself (Figure 1). A speculative explanation for this is the significant drop in energy prices, which was a decisive factor in the acceleration of inflation in all countries during 2021-2022. This interpretation is also supported by the movements of cross-country inflation dispersion. As pointed by e.g. Cochrane 2024, the increase in price dispersion can be seen as a sign of supply shocks, and that might be the proper interpretation of the developments of 2021-2023.
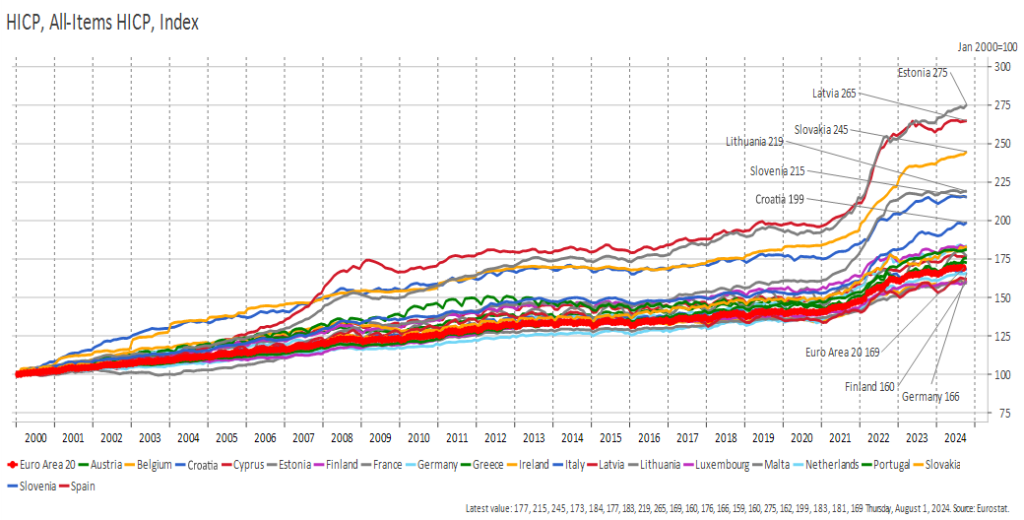
From a policy perspective, the concerning aspect of these developments was just the massive increase in the dispersion of inflation rates. True, to some extent the differences can be explained by the proximity of Russia and the consequences of the war in Ukraine. But as Figure 2 indicates, inflation rates have differed long before the war causing very large cumulative differences, which show up in the diverging price levels. In the context of a Taylor rule, you have to balance the preferences of low- and high-inflation countries, but it is not all clear how this is done. Before mid-2021, the gap between the maximum and minimum inflation rates was consistently around four percent. By April 2023, the gap had widened to 23 percent. However, by September 2024, the gap had narrowed to just five percent, which is not far from the ‘normal’ rate. Even so, these kinds of developments were surely not anticipated when the statutes of the ECB were written.
Figure 1. Average rate of inflation and the cross-country dispersion
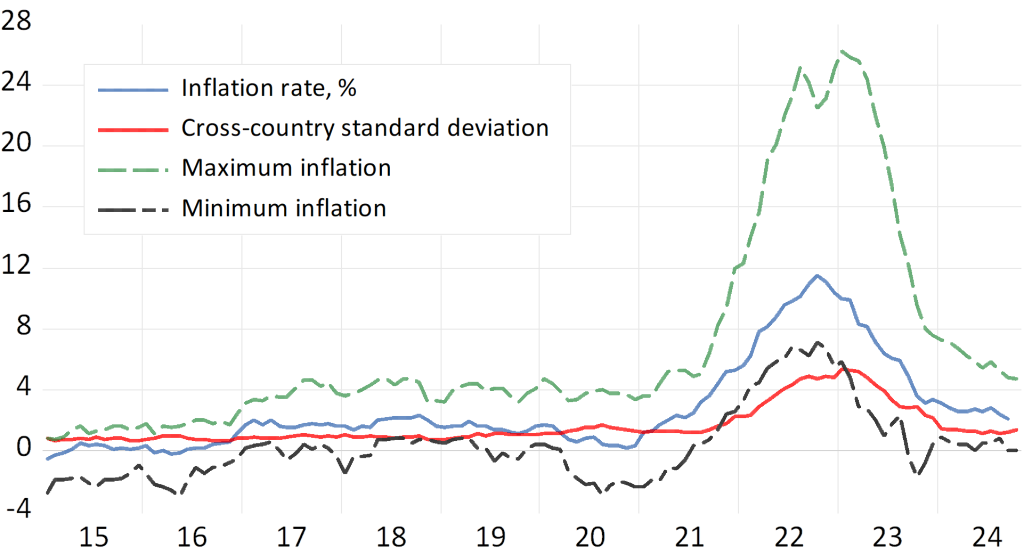
Figure 2. Development of price levels in Europe
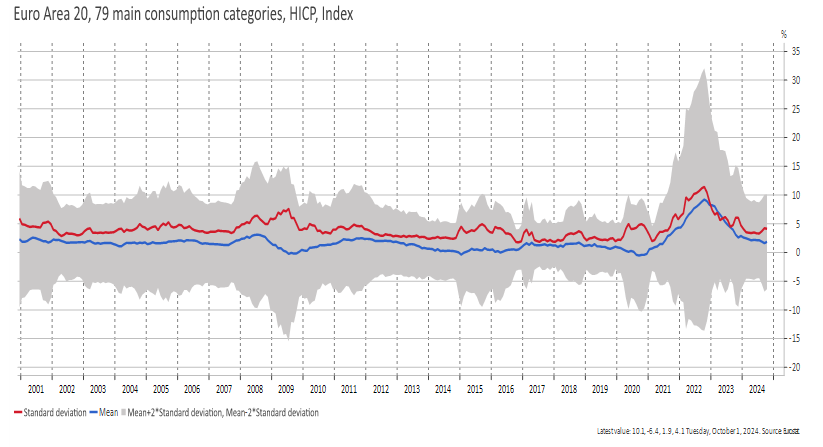
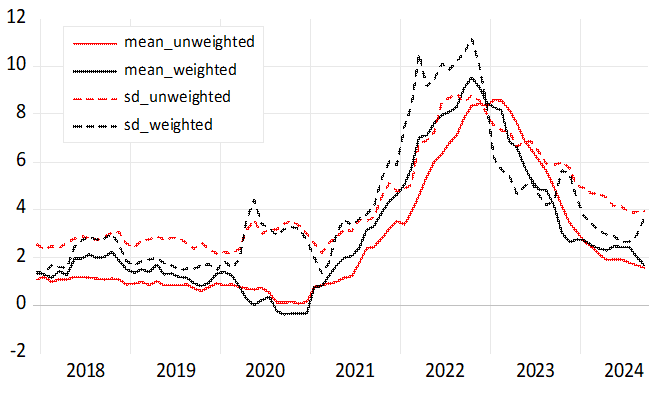
If we turn to the aggregate values of inflation for the Euro Area using our semi-microdata from 280 commodity categories, we unsurprisingly find the same features as in the cross-country data: a huge peak of inflation accompanied by a similar peak in the dispersion of inflation (Figure 3)1 . Clearly, the peak is much higher than during 2007-2009, and the dispersion is even greater. In the same way as in 2009, dispersion has decreased very quickly, even though not as fast as the rate of HICP inflation.
Figure 3. Main features of inflation for the Euro area
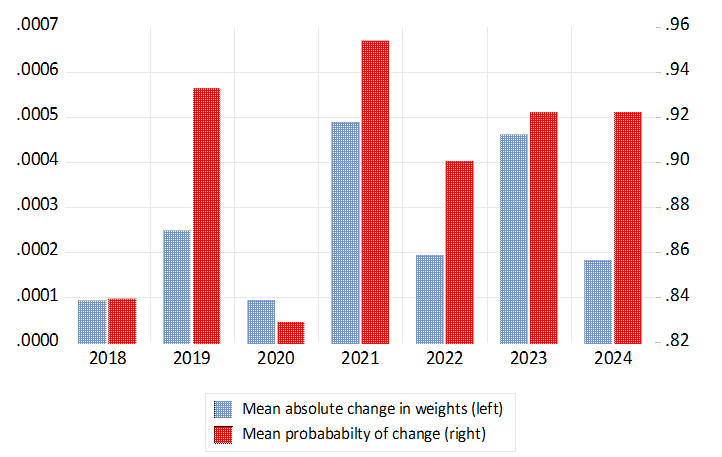
The value of the customary HICP (Harmonized Index of Consumer Prices) depends on weights that are intended to represent the previous year’s consumption patterns. Clearly, there has been more movement in the structure in recent years due to inflation itself and the Covid-19 pandemic (Figure 4). Although it is difficult to identify a clear trend in the values of the absolute changes, it seems apparent that sensitivity has increased such that the overall frequency has changed: there is more dynamism in the consumption structure.
Figure 4. The change rate and the size of changes in HICP weights
But what is the impact of weights, in general, or more broadly, the impact of the consumption structure? One can readily conclude that in normal times, the contribution is negligible (se Figure 5 and Hukkinen and Viren 2024). Thus, the inflation numbers do not differ even if we use unweighted means or even the medians of the price indexes. Only in 2022 does weighting make a difference. But even then, we can approach the official numbers using the fixed 2018 starting value weights. Then the difference in the peak values is 0.6 percentage points, but the difference soon fades away. In 2023 and 2024, the difference between these time series is practically zero so that in September 2024 the difference is only 0.03 per centage points. Closer scrutiny reveals that the difference in 2022 results from a lagged response to changes in consumption patterns during the Covid-19 pandemic. The changed patterns affect the weights
of the 2021 index and, subsequently, also the 2022 index values.
Figure 5. Effect of weighting on inflation numbers of 280 commodity categories
With the microdata, we can scrutinize the dispersion indicators and attempt to compute the probability of price changes and decompose the inflation rate into different types of inflation regimes. We have already observed that inflation dispersion, measured by the cross-section standard deviation computed over the inflation rates of 79 or 280 commodity groups, has decreased, even though the values are still above the old normal (Figure 3) and cross-county dispersion shown in Figure 1. The developments during the last months are indeed puzzling suggesting that the relative prices have not settled down to equilibrium values.
Interestingly indicators for the probability of price changes have not decreased at the same rate as the dispersion (Figure 6). As a result, prices are being changed more frequently than they were before the high-inflation period. How can we explain this finding, given that the cross-section distribution of inflation rates has decreased so much? An obvious explanation is that price movements are pointing in the same direction. A speculative comment is that this may reflect the large number of commodities that are somehow related to energy prices, which have been the main driver in the decline of CPI inflation.2 Unfortunately, we do not have data that would allow us to scrutinize previous inflation episodes and see whether the frequency of price changes follows a symmetric pattern with respect to the peak of inflation. We see only that in the aftermath of the financial crisis in 2009, cross-section dispersion decreased much more rapidly than in 2023 and 2024.
If we look more closely at the pattern of price changes, we observe that the general outcome is not dominated by ‘regular’ change rates, which could be thought to be between zero and one percent (Figure 6).
Instead, the outcome was dictated by very large change rates (implying annual inflation over ten percent) or deflation. It appears that the first sign of high inflation was the end of deflation, which was then accompanied by very high price increases in several (30%) of commodities. Very high deflation rates did not play much of a role in the sequence of events, and clearly, there have not been many very large price drops after the inflation peak in 2022.
Referring back to Figure 6, one might also consider whether recent developments in automated pricing systems could have impacted the observed values of the abnormally high share of changed prices. We can only observe that the market for different automated pricing systems has ‘exploded’ in recent years (following the example of Amazon, cf. Calvano et al., 2020). If that is indeed the case, it could dramatically change the landscape of economic analysis, moving it away from the basic assumption of sticky prices and the semi-automated use of Calvo pricing in building macro models.”
Figure 6. The shares of changed prices according to monthly change rates
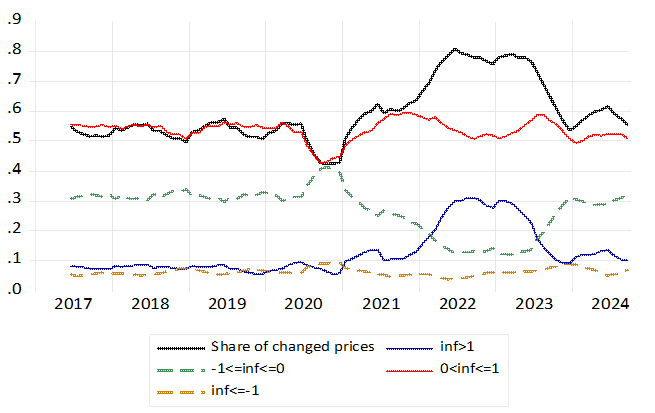
Notes: The share of changed prices is here defined as the share of commodity groups, in which the change rate is more than 0.05 %. All curves are 12-moth moving averages. Notation inf>1 indicates the share of price categories in which monthly inflation is more than one percent. Similar logic applies to other series.
Regardless of what happens in the future, it is clear that inflation has re-emerged as a significant issue in macroeconomics. This compels us to pay closer attention to the empirical measures we use in our analytical work. We must understand what is behind the figures that are so closely monitored every month by economists and the general public. Take one example. There are signs that the revival of inflation may have had a profound effect on pricing practices and technologies and hence also on the magnitude of price rigidity.
Calvano, E., G. Calzolari, V. Denicolo and S. Pastorello (2020) Artificial Intelligence, Algorithmic Pricing, and Collusion, American Economic Review 110, 3267–97. https://www.aeaweb.org/articles?id=10.1257%2Faer.20190623
Cochrane, J. (2025) Inflation and relative prices. The Crumpy Economist blog Nov. 18, 2024. https://www.grumpy-economist.com/p/inflation-and-relative-prices
Eurostat (2018) Eurostat HICP Methodological manual 2018 https://ec.europa.eu/eurostat/documents/3859598/9479325/KS-GQ-17-015-EN-N.pdf/d5e63427-c588-479f-9b19-f4b4d698f2a2?t=1547028935000
Hukkinen, J and M. Viren (2024) Devil is in the details: (mis)measurement of inflation. SUERF Policy Brief 855. https://www.suerf.org/wp-content/uploads/2024/04/SUERF-Policy-Brief-855_Hukkinen-Viren.pdf
Knetsch, T. P. Schwind and S. Weinand (2022) The impact of weight shifts on inflation. Evidence for the Euro Are Inflation. Deutsche Bundesbank Discussion paper 27/2022. https://papers.ssrn.com/sol3/papers.cfm?abstract_id=4201917
The detailed HICP data with weights cover the period from December 2016 to September 2024, while the incomplete price data goes back to 1996. The data consist of 280 commodity categories, which provide the basis for calculating the Euro area-wide value of the HICP index. Two categories, for which weight data are not available for the early part of the sample, are not included in our computations (which makes a small difference in the CPI). Unfortunately, these complete data go back to 2016 only. We have, however, constructed a more aggregative data from 79 main consumption categories that go back to 2000 (and are used in Figure 3). For 2016-2024 these data come very close to the more detailed data of 280 items. All data come from Eurostat.
96 per cent of variation in the HICP annual inflation can be explained just by two commodities: liquid fuels and bread.