In our recent research, we have highlighted how a dramatic decline in mobility was needed to push the reproduction number of COVID-19 below one and gain control of the pandemic (see here). In this note, we consider how much mobility can increase while keeping the reproduction number below one and, thus, limiting the risk of a second wave of infection. Fortunately, a number of developments can play a role in depressing the reproduction number even as mobility increases.
On the basis of some illustrative calculations, we find mobility can recover to around halfway between the pre-lockdown level and the full-lockdown level, without an extensive testing and contact tracing regime. The analysis here has been conducted for the UK, but the framework can be applied to other countries in Europe and elsewhere that do not yet have an extensive testing and contact tracing regime.
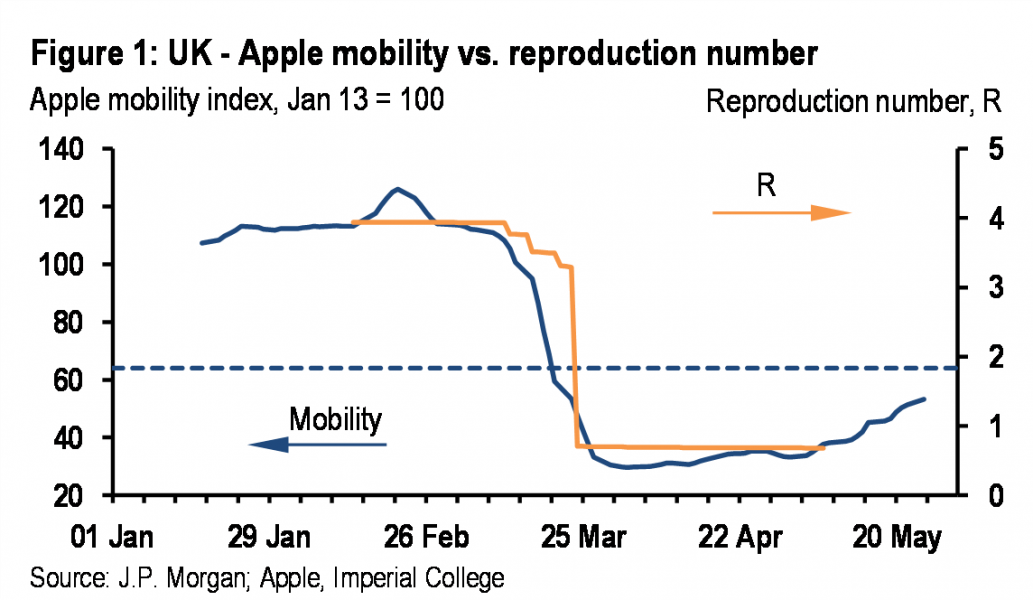
It is clear that the COVID-19 pandemic has been contained by a dramatic decline in mobility, which has limited the number of contacts between infectious individuals and susceptible individuals (Figure 1). As restrictions are eased, mobility is increasing. How much can it rise without threatening a second wave of infection?
In addition to the dramatic decline in mobility, a number of other developments also could have weighed on the reproduction number (Table 1). We start with the basic reproduction number (R0), which in the UK is estimated at 3.3 by Imperial College.2 We have identified five factors that could be weighing on the effective reproduction number (Re) in addition to the decline in mobility. While the estimates in Table 1 are reasonable, we would stress the high level of uncertainty about almost everything to do with COVID-19.
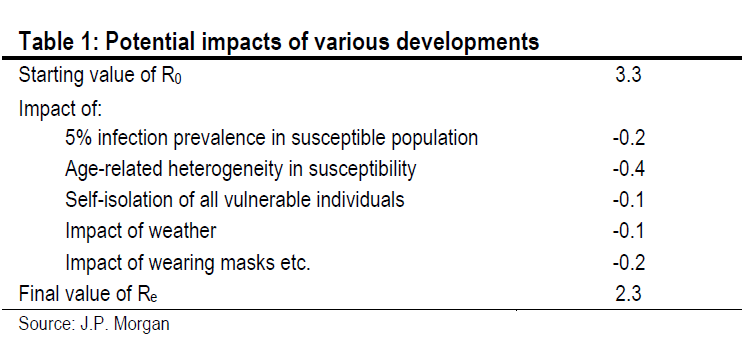
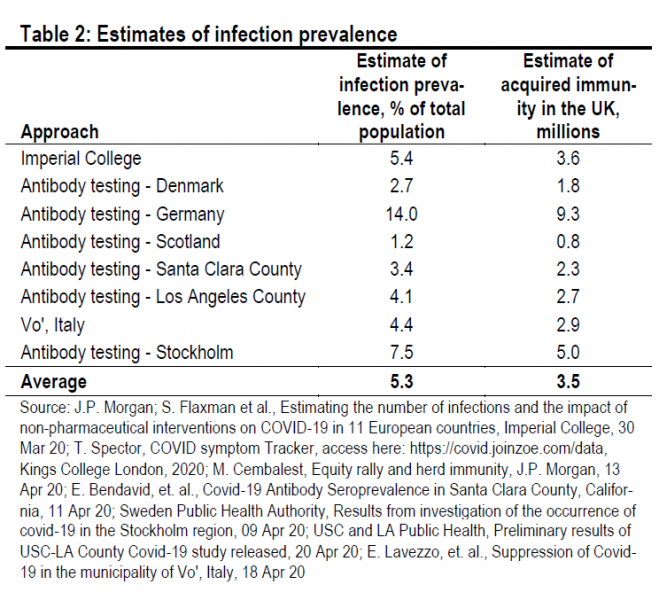
First, acquired immunity. Re is affected by the acquired immunity in the population. The greater the proportion of individuals who have immunity through infection and recovery, the harder it is for infectious individuals to spread the virus. A wide variety of estimates – either antibody tests or modelling exercises – suggest that infection prevalence and, thus, acquired immunity is around 5% of the total population (Table 2). This pushes down Re by 0.2 (R0 – R0 * 0.95).
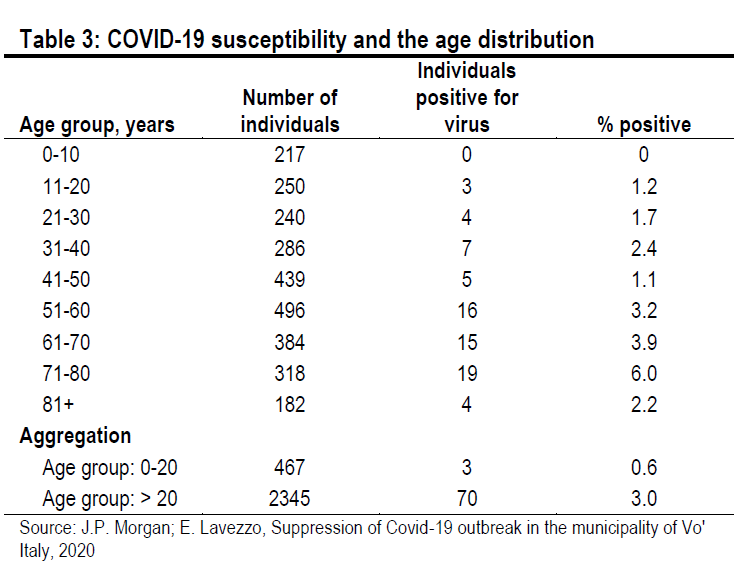
Second, age-related heterogeneity in susceptibility. Simple epidemiological models assume that everyone in the population is equally susceptible to infection at the start of an epidemic. This does not appear to be the case for COVID-19. We know that morbidity and mortality increase with age, but it also seems that susceptibility to infection increases with age. In the Italian municipality of Vo, for example, where almost the entire population (86%) was tested for the virus after the municipality was completely locked down on February 23, only 0.6% of those aged under 20 tested positive while 3.0% of those aged over 20 tested positive3 (Table 3).
A strong impression of age-related susceptibility is also evident in an Icelandic study of 9,199 individuals (2.5% of the total population).4 Of the 564 children aged under 10 years, only 38 (6.7%) tested positive. Meanwhile, of the 8,635 individuals aged over 10 years, 1,183 (13.7%) tested positive. In Table 1, we assume that only 50% of individuals under the age of 20 are susceptible. This represents 12% of the UK population. This pushes down Re by 0.4 (R0 – R0 * 0.88).
Third, self-isolation of older individuals. The UK government is not inclined to introduce any formal agerelated restrictions. But, nevertheless many older individuals who feel vulnerable may decide to continue to shield themselves from contact with the rest of the population. In Table 1, we assume that 25% of individuals above the age of 70 decide to continue shielding themselves. This would represent 3% of the UK population, and would push Re down by 0.1 (R0 – R0 * 0.97).
Fourth, the impact of the weather. Generally, respiratory viruses thrive better in colder, drier conditions, for a number of reasons: first, viruses are more stable in cold weather with low levels of ultraviolet light; second, respiratory droplets remain in the air for longer in drier conditions; third, individuals have more contacts when staying indoors during winter; and fourth, immune systems can be run down in winter by reduced vitamin D due to less exposure to sunlight.
Empirical work suggests a very modest impact of temperature and relative humidity on the transmission of COVID-19. For example, Wang et al.5 estimate that a 1°C increase in temperature reduces Re by 0.023, while a 1% increase in relative humidity reduces Re by 0.0078. In Table 1, we apply these coefficients to changes in UK weather since March and find that Re is reduced by 0.1.
Fifth, the impact of wearing masks, etc. During the COVID-19 pandemic, individuals have been encouraged to wear masks, wash their hands regularly, use hand sanitizer, and conduct more frequent cleaning operations to reduce the likelihood of infection given contact between an infectious individual and a susceptible individual.
Unfortunately, there is very little empirical work on the efficacy of these actions. A meta-analysis of 14 trials showed no impact of wearing masks on the spread of influenza type infections.6 In Table 1, we assume that all of these increased hygiene measures reduce the reproduction number by 0.2. But, this estimate is particularly uncertain.
On the basis of the calibration that we have assumed, the five developments that we have identified could push the reproduction number down by 1.0pt (from 3.3 to 2.3). If mobility were to quickly return to pre-lockdown levels, Re would move back towards 2.3, which would guarantee a second wave of infection. This suggests that, absent an extensive testing and contact tracing regime, mobility will need to remain subdued relative to prelockdown levels. The experience in recent months suggests that 10pts on the Apple mobility index equals 0.39pt on the reproduction number. If we need to keep Re at 0.9, and prevent it from moving up to 2.3, then the Apple mobility index needs to stay around 36pts below the pre-lockdown level. This is just under halfway back from the full-lockdown level, as illustrated in the horizontal line in Figure 1. The only way for mobility to increase further than this is to introduce an extensive testing and contact tracing regime, which for the UK, at least, is only beginning to take shape. The efficacy of contact tracing is also influenced by the level of new infections at the start of lockdown easing. These were still relatively high in the UK when lockdown easing began.
This SUERF policy brief includes research content published by J.P. Morgan on 28 May 2020. J.P. Morgan has granted SUERF a limited right to re-publish this research on an information only basis. J.P. Morgan has no liability in any regard for the publication of this SUERF policy brief or SUERF’s decision to reproduce any J.P. Morgan research content contained herein. It is not an offer to buy or sell any security/instruments or to participate in a trading strategy or trading activity; nor does it constitute any form of personal financial advice or investment recommendation by J.P. Morgan. This information should not be relied upon for any reason whatsoever by any natural or legal person. For important current standard disclosures that pertain to J.P. Morgan’s research please refer to J.P. Morgan’s disclosure website: https://www.jpmm.com/research/disclosures
Imperial College estimates of R can be accessed here: https://mrc-ide.github.io/covid19estimates/#/
E. Lavezzo, Suppression of Covid-19 outbreak in the municipality of Vo’ Italy, 2020
D. Gudbjartsson, Spread of SARS-CoV-2 in the Icelandic population, 2020.
J. Wang, et al., High Temperature and High Humidity Reduce the Transmission of Covid-19, 2020.
T. Jefferson, Physical interventions to interrupt or reduce the spread of respiratory viruses, 2020.