This paper should not be reported as representing the views of the European Central Bank (ECB). The views expressed are those of the authors and do not necessarily reflect those of the ECB. We are grateful for
comments and suggestions by Maurice Bun, Alessandro Calza, Stefano Corradin, Marco Corsi, Maximilian Dinse, Adina Fudulache, Benjamin Hartung, Isabel Schnabel, Marta Skrzypin ska, Thomas Vlassopoulos, members of the Market Operations Committee (MOC) of the Eurosystem, members of the Eurosystem’s Working Group on Monetary and Exchange Rate Policy Implementation Framework (WGME) and an anonymous referee of the ECB Working Paper Series.
This policy brief provides an overview of the main findings of the research described in our paper ‘Liquidity coverage ratios and monetary policy credit in the time of Corona’. When a bank receives credit from the central bank, its Liquidity Coverage Ratio (LCR) changes. In most cases, the LCR increases. We investigate how this LCR boost from central bank credit affects banks’ behaviour, looking at the euro area during the Corona year 2020. Our theoretical and empirical analyses suggest that banks that get strong LCR boosts from central bank credit tend to take actions that reduce their LCRs. In this sense, banks consume their LCR boosts. In terms of policy conclusions, our analysis suggests that central bank credit operations can provide strong incentives for banks to take actions that reduce their LCRs. Such actions, which could include the provision of additional credit and a shortening of the maturity structure of the liabilities of the banks, plausibly have an impact on the real economy. As such, our analysis reveals what may be called an “LCR channel” of monetary policy transmission.
When the Corona pandemic hit Europe in 2020, the Eurosystem granted large amounts of credit to commercial banks at particularly favorable conditions. These operations aimed to ease lending conditions. They lowered banks’ funding costs and eased their liquidity management, in particular as they allowed banks to improve their Liquidity Coverage Ratios (LCRs1). We study (i) the immediate impact that the central bank credit had on banks’ LCRs and (ii) how this immediate impact influenced the behavior of banks complying to the LCR requirements. In doing so, we aim to better understand behavioral effects which constitute the transmission of large-scale credit operations. Our empirical analysis is based on a large set of data covering the period from Q4 2019 to Q4 2020 for all individual banks with access to Eurosystem credit operations. This includes data on LCRs, Eurosystem credit operations and assets used as collateral in such operations.
Participation to central bank credit operations has an immediate impact on a bank’s LCR, which is positive in most cases. When a bank receives credit from its domestic central bank, its Net Liquidity Outflow (the denominator of the LCR) does not change, while its Liquidity Buffer (the LCR numerator) increases if the bank collateralizes the central bank credit mainly with assets that are not classified as HQLA.
For our study, we decompose quarterly LCR changes for each bank and each quarter into two components: (a) the LCR change resulting immediately from net central bank credit – we call this the “technical LCR boost”; and (b) the LCR change resulting from all other factors. These other factors may include changes of the market price of HQLAs, changes in the amount or the nominal value of HQLAs (excluding reserves received from central bank credit operations) held by the respective bank as well as changes in the maturity structure of the bank’s liabilities which change the denominator of the LCR. Note that the latter two factors depend to a large extent on the bank’s behavior, i.e. LCR changes due to factors other than central bank credit are not exogenous to the bank. The bank can, for example, reduce its LCR by providing additional loans or by shortening the maturity structure of its liabilities.
A simplified numerical example provided in Table 1 illustrates how we decompose quarterly LCR changes2. The columns display a banks’ LCR data as reported before the central bank credit operation, the effect of the participation to the credit operation and the reported LCR data after the credit operation. The effect of the credit operations to the bank’s LCR, the technical LCR boost (in this example 40%), can be calculated on the basis of detailed information on the banks LCR and participation (and collateralization) to the central bank credit operation. As a residual we are able to calculate the LCR change resulting from all other factors, which in this example would be -30 percentage points (200%-190%-40%).
Table 1: A simplified numerical example of a bank’s LCR decomposition
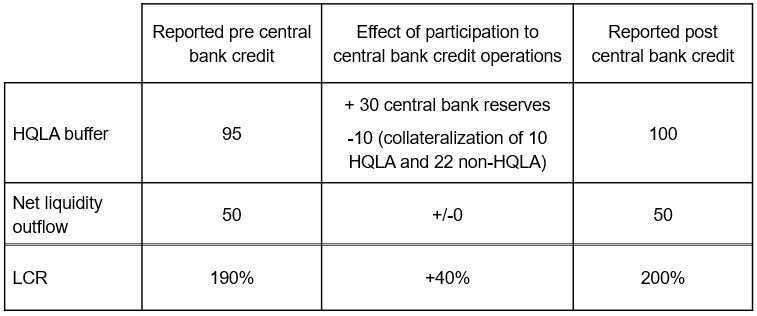
Chart 1 shows the relation between the quarterly net central bank credit received (horizontal axis) and the technical LCR boost resulting from it (vertical axis) for each quarter and each bank in our sample. Dots on the diagonal line are cases where the technical LCR boost equals the related net central bank credit divided by the Net Liquidity Outflow. Such cases occur when only non-HQLA become encumbered due to the net central bank credit, i.e. the Liquidity Buffer increases exactly by the amount of net central bank credit received which may be positive or negative.
Chart 1: Net Eurosystem credit and technical LCR boosts
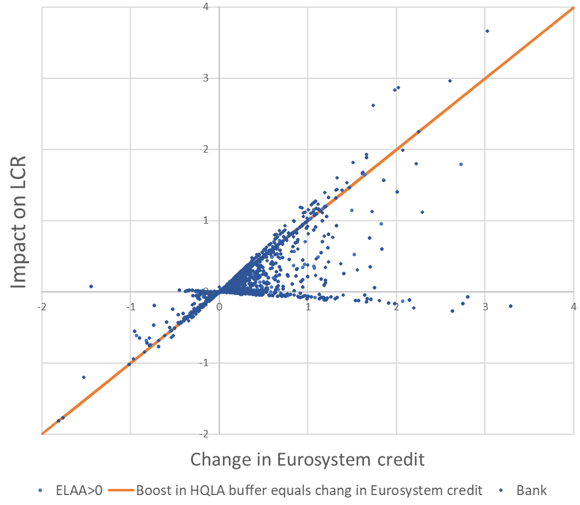
Note: Each blue dot represents a bank at quarter-end for one of the four quarters in 2020. The x-axis shows the net Eurosystem credit amount (divided by the net liquidity outflow) received by the bank during the quarter and the y-axis shows the Technical LCR boost from this net Eurosystem credit amount for the bank. Source: ECB.
71% of the observations are between the diagonal and the x-axis. These concern cases in which the net central bank credit and the technical LCR boost are positively related, but the technical boost falls short of the net central bank credit amount (divided by the Net Liquidity Outflow). A positive net credit amount increases the Liquidity Buffer while the additional amount of encumbered assets (used as collateral for the credit amount) reduces it. But the increase is stronger than the reduction if some of the assets that get additionally encumbered are non-HQLA.
The results of our decomposition of LCR changes are shown on an average basis in Chart 2. The dotted line shows how the average LCR would have changed from one quarter to the next without the technical LCR boost from central bank credit, and the dashed line shows the technical LCR boosts. As can be seen, the average technical LCR boost was particularly strong in Q2 2020 when the Eurosystem granted a record amount of new credit to the banking sector.
Chart 2: Evolution of average LCR, reported and hypothetical case
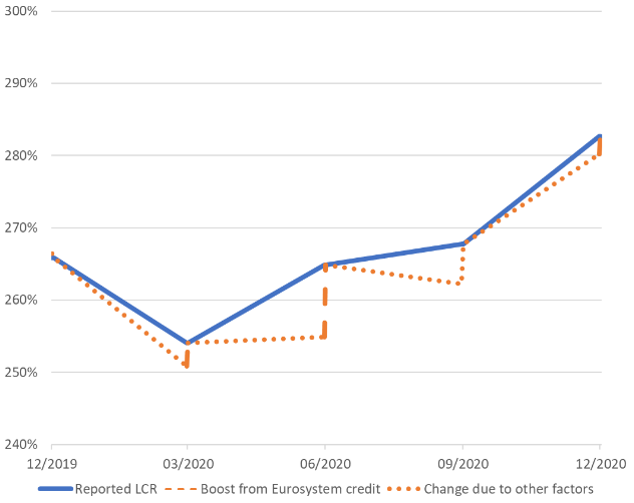
Note: Average reported LCR (blue) is calculated as the simple average of the liquidity buffers across all banks divided by the simple average of the net liquidity outflows across all banks. The “Boost from Eurosystem credit” shows how much lower the average reported LCR would have been, if the banks had received a net credit amount of zero from the Eurosystem in the respective quarter (hypothetical case). Source: ECB.
In order to understand how technical LCR boosts from net central bank credit affect banks’ behaviour, we investigate the causal effects of such technical LCR boosts on LCR changes due to all other factors, as the latter reflect banks’ behavior (other than recourse to central bank credit). Doing so is not straightforward as causalities may go into both directions. If a bank achieves a large technical LCR boost, then it has more space to engage in activities that have a negative impact on the LCR. This suggests that the technical LCR boosts may have a negative impact on LCR changes due to all other factors. At the same time, if the LCR changes due to all other factors are large and negative, the preference for a bank to achieve large positive technical LCR boosts might be enhanced. This suggests that LCR changes due to all other factors may have a negative impact on the technical LCR boost.
Therefore, a statistical relation between our two central variables may reflect causalities in both directions. However, based on empirical, theoretical and institutional considerations, it can be argued that in the euro area during the Corona year 2020, the causal effect from LCR changes due to all other factors on banks’ technical LCR boosts was negligible.3
In our empirical analysis, we regress quarterly LCR changes resulting from all other factors on (i) the LCR at the end of the previous quarter and (ii) technical LCR boosts at the end of the current quarter. We also include a number of control variables in our regressions. We run our regression on a sample including all banks except a few outliers, but also on different samples from which we exclude banks with relatively high LCRs.
When using our main sample, our regressions shows a highly significant negative relation between our dependent variable and our two main independent variables. Hence, banks which benefit from a large positive technical LCR boost are likely to have large negative LCR changes due to factors other than central bank credit. When we run the regressions with smaller samples, excluding first banks with very high, then banks with high and finally banks with moderate LCR levels, our coefficients of interest become increasingly negative. In addition, the explanatory power of our model improves significantly. This indicates that for banks with high LCRs, the relation between our dependent variable and our two main independent variables gets weaker.
We provide a simple explanation for our results by means of a theoretical model. The model implies that if a bank with a low initial LCR achieves a large technical LCR boost, then it has more space to carry out activities that have a negative impact on the LCR and it will use this space. A bank with a high initial LCR would already be able to carry out such activities, regardless of whether it achieves a large technical LCR boost or not. It therefore has no additional incentives to use such space after a technical LCR boost.
Our analysis suggests concrete policy conclusions. If the central bank designs its credit operations in a way that provides banks with strong incentives to participate in them, e.g. due to an attractive pricing, and allows participating banks to obtain strong technical LCR boosts, then participating banks that have relatively low initial LCRs are likely to take actions that reduce their LCRs. Such actions, which could include the provision of additional credit and a shortening of the maturity structure of the liabilities of the banks, plausibly have an impact on the real economy. As such, our analysis reveals what may be called an “LCR channel” of monetary policy transmission. This LCR channel may be most effective in times of existing or expected liquidity tensions when banks may be reluctant to extend new loans to the economy as they fear that regulatory liquidity constraints could kick in.
Gocheva, Viktoriya and Mudde, Yvo and Tapking, Jens, (2022), Liquidity Coverage Ratios and Monetary Policy Credit in the time of Corona, European Central Bank Working Paper No. 2668.
The LCR was proposed by the Basel Committee on Banking Supervision (BCBS) in 2010 as a new regulatory tool to ensure that banks hold a sufficiently high Liquidity Buffer to meet all payment obligations upcoming over a 30-day horizon. It is defined as a bank’s Liquidity Buffer divided by the bank’s Net Liquidity Outflow (over a 30-calendar day stress period). The Liquidity Buffer is the value of unencumbered high-quality liquid assets (HQLA). The Net Liquidity Outflows is estimated as the sum of (expected) liquidity outflows minus the sum of (expected) liquidity inflows. In the European Union, every bank has to maintain an LCR of at least 100%.
The example illustrates the way we decompose LCR changes only partially and therefore gives only a first idea of our approach. The full approach, which takes into account LCR and Eurosystem haircuts as well as LCR caps, is described in Gocheva, Mudde and Tapking (2022).
See Gocheva, Mudde and Tapking (2022).