This Policy Brief is based on Banco de España Documentos Ocasionales. N.º 2407. The opinions expressed are those of the authors and do not necessarily coincide with those of the Banco de España or the Eurosystem.
We assess how magnitudes constructed from the Spanish Survey of Household Finances (EFF) micro data compare with magnitudes from alternative sources, including the Financial Accounts of the Spanish Economy (FASE) and other income and consumption surveys. We analyse the main differences among the sources and the main concepts that can be compared. For those conceptually comparable magnitudes, we quantify the degree to which the EFF magnitudes capture those of the other sources used. We document a high degree of conceptual and quantitative comparability. Our results show that aggregate non-financial assets and debts from the EFF are similar to the aggregated magnitudes of other sources, while the comparison for each individual financial asset category varies. For income, the aggregate calculated from the EFF data is close to the aggregates.
The Spanish Survey of Household Finances (EFF1 by its Spanish acronym) is a household survey which has been conducted every three years2 by the Banco de España, with the main objective of providing detailed information on Spanish households’ wealth and financial decisions. In addition to the EFF, there are other statistical sources in Spain that provide information on the financial situation of Spanish households. From the macro data perspective, the Spanish National Accounts (SNA), produced by the National Statistics Institute (INE by its Spanish acronym), which provide aggregates for income earned and expenditure and three statistics computed by the Banco de España. Financial Accounts of the Spanish Economy (CFEE) provide information on financial assets held by household, the housing market Summary Indicators (SI) which provided an estimate of the market value of the total stock of housing held by households and the Statistical Bulletin (BE by its Spanish acronym) is constructed using the information from the balance sheets that credit institutions provide to Banco de España. At the micro level, the Household Budget Survey (HBS), which is produced by the INE, provides detailed information on household expenditure, and the European Union statistics on income and living conditions (EU- SILC), also conducted by the INE and coordinated by Eurostat, provides detailed information on income at the household level.
All of these statistical sources have their own objectives, methodologies and definitions, which determine the nature of the information and the magnitudes they provide. Despite those potential differences, comparing EFF data with these other sources is of interest in order to assess how well the EFF approximates national aggregates or some distributional characteristics obtained from reliable benchmarks. We study non-financial and financial assets, household debts, income and expenditure.3 We do this for all available survey waves (2002-2020) and show how the comparison has evolved over time for the different concepts of interest.
The definition of the household sector differs between macro and micro sources. The macro definition includes not only households but also individuals or groups of individuals as producers of goods and non-financial services for their exclusive final use, it also includes non-profit institutions serving households (NPISHs) and institutional households. A second difference refers to the definition and the valuation criteria used to compute magnitudes for the financial and non-financial assets held by households. Third, both the macro statistics and micro surveys are subject to different approximation and statistical errors, given the differences in how the information is collected and processed. As a result, quantitative discrepancies are expected even when similar definitions and valuation criteria are applied. Finally, the reference period for macro data is generally the end of the quarter, while the EFF data is collected over a period of 8-9 months starting in October of the reference year.4 Although households are interviewed approximately uniformly over the data collection period, the survey agency is contractually obliged to complete 50% of the interviews by the end of the reference year.
There are four main conceptual differences between the EFF and the estimation of housing wealth by the SI. Firstly, the survey figure refers to real estate wealth, while the aggregate data considers only the stock of housing. Secondly, the aggregate measure is based on the assumption that the entire stock of housing belongs to households, which is not necessarily the case (García and Roibás, 2020). Thirdly, the aggregate measure does not include housing wealth abroad, whereas in the survey these are included. Lastly, the valuation of the aggregate data is based on appraisals up to 2004 and transaction prices thereafter, while the survey data is based on households’ estimated market values. The EFF/SI ratio for housing wealth is between 60% and 70%, capturing quite well the time trend of housing wealth (see Table 1). The gap between both sources might also be explained by the second conceptual difference mentioned above, i.e. the stock of real state wealth being assigned to all households. However, there are also institutions, such as hedge funds and non-profit organisations, that own real estate assets and the aggregate measure does not differentiate between them.
Table 1: Wealth (non financial and financial) and liabilities according to EFF and other comparable sources
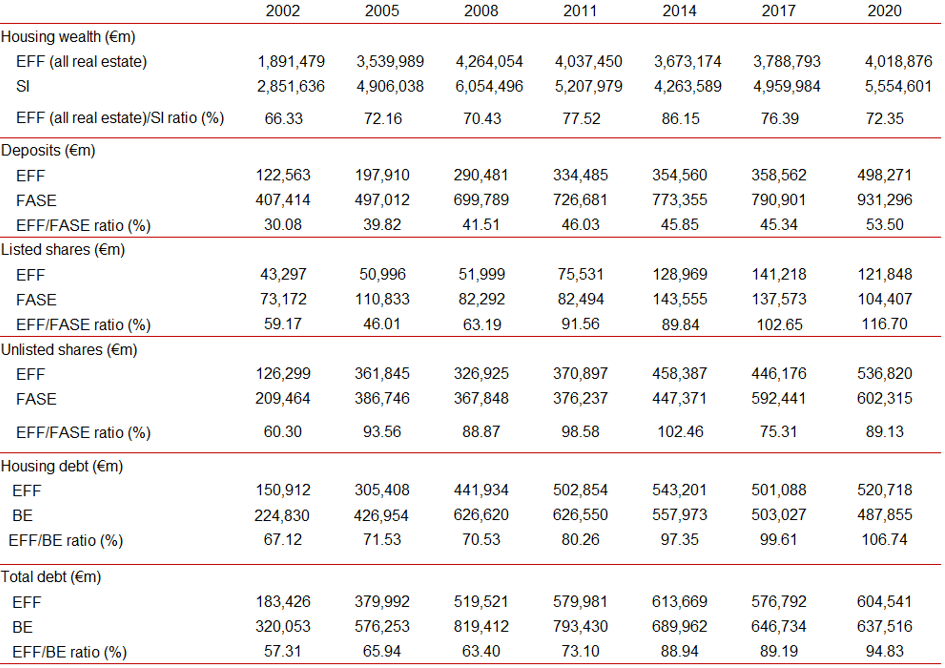 Sources: Banco de España (EFF, Summary Indicators (SI)), FASE (ESA 2010) and Statistical Bulletin (BE)).
In the case of financial assets, the comparison of deposits is difficult as households underreport this asset in surveys due to its sensitivity (Andreasch and Lindner, 2014), if there is personal business may be difficult to report and deposits are liquid so can vary considerably over time. Taking into account these problems the ratio of EFF and CFEE for 2020 is 53.5% (see Table 1).
Listed shares measures the market value that households own in publicly traded companies with a single question in the EFF and there is no conceptual difference with respect to the CFEE counterpart. In contrast, to make a comparison of estimates for unlisted shares and other equity from the EFF and the CFEE, it is necessary to eliminate from the EFF the value of household businesses whose legal personality is not a natural person.
As the results in Table 1 show, the discrepancies between the EFF and the macro estimates have decreased over the years for both listed and unlisted shares. In particular, the EFF/ CFEE ratio has evolved from 59% in 2002 to 117% in 2020 for listed shares and from 60% in 2002 to 89% in 2020 for unlisted shares. The EFF collects debts outstanding with any kind of institution. However, for comparability with the BE series, we only compare debts arranged with financial institutions. The EFF measurement of total household debt as compared with the BE has increased over time: it started in 2002 with a share close to 60%, while in 2020 this share was 95% (see Table 2). Another relevant comparison is the measurement of total debt for house purchase, the EFF started with a ratio of 67% in 2002 and reached 107% in 2020.
Income data is collected in the EFF in gross terms (meaning that taxes and social security contributions are included) and in annual terms referring to the previous calendar year of the corresponding wave. The results in Table 2 show a positive trend in capturing total annual income in the EFF. The comparison to the EU-SILC provides closer results, with an EFF/EU-SILC ratio of close to 100% for all waves except for 2005, which can be explained by methodological difference in the EU-SILC until 2008. However, the comparison to SNA also generates ratios of around 85%, which are also stable over time. In addition, we also compare total monthly income, which in the EFF is a measure of total household income received in the month of the year in which the interview is conducted. This includes income from work, unemployment benefits, welfare or private insurance, retirement, inactivity or permanent incapacity to work pensions, income not related to work activity and returns on assets. The ratio of the EFF to the corresponding SNA measurement has increased across the waves, reaching 87% in 2020.
Finally, we compare expenditure on food and non-durable goods between EFF, HBS and SNA. There are differences on methodology across the two micro surveys such as in the HBS households keep a diary of the different expenses they incur when they buy goods and services, the EFF collects data on expenditures for broad concepts of expenditure by means of a single question in the EFF are asked at the end of the interview when interviewees are more prone to speed up the interview.
Regarding aggregate food expenditure, the EFF accounts for more than 91.5% of the HBS concept and for around 66% of the corresponding SNA item in Table 2. The comparison of the distributional features, mean and median, of this concept provides similar results (ratios of approximately 80% and 90%, respectively). These results confirm that the EFF captures quite well the distribution of food expenditure. For non-durable goods5, the ratios reach around 60% to 70% for all the comparable measures (total, mean and median).
Table 2: Income and expenditure according to EFF and other comparable sources
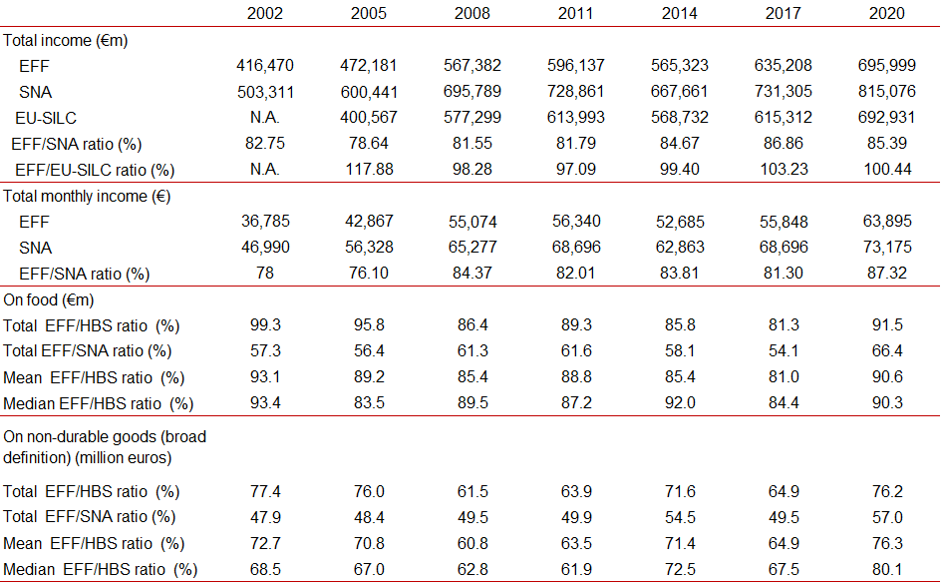 Sources: Banco de España (EFF) and INE (SNA, EU-SILC and EPF).
In this paper, we provide a comprehensive and detailed comparison of the more relevant EFF economic measurements to other available statistical sources that provide comparable economic information on Spanish households. In this respect, we assess how the survey approximates national aggregates or some distributional characteristics obtained from reliable benchmarks, which constitutes an evaluation of the EFF survey data since 2002. Additionally, the results also contribute to the literature on distributional wealth accounts, where the linkage between micro and macro data is essential to provide accurate estimates.
Ahnert, Henning, Ilja Kristian Kavonius, Juha Honkkila and Pierre Sola. (2020). “Understanding household wealth: linking macro and micro data to produce distributional financial accounts”. ECB Statistics Paper Series, 37, European Central Bank. https://ideas.repec.org/p/ecb/ecbsps/202037.html
Andreasch, Michael, and Peter Lindner. (2014). “Micro and macro data: a comparison of the Household Finance and Consumption Survey with financial accounts in Austria.” ECB Working Paper Series, 1673, European Central Bank. https://www.ecb.europa.eu/pub/pdf/scpwps/ecbwp1673.pdf
Barceló, Cristina, Laura Crespo, Sandra García-Uribe, Carlos Gento, Marina Gómez and Alicia de Quinto. (2020). “The Spanish survey of household finances (EFF): description and methods of the 2017 wave”. Documentos Ocasionales, 2033, Banco de España. https://repositorio.bde.es/bitstream/123456789/14531/1/do2033e.pdf
Batty, Michael, Jesse Bricker, Joseph Briggs, Sarah Friedman, Danielle Nemschoff, Eric Nielsen, Kamila Sommer and Alice H. Volz. (2020). “The Distributional Financial Accounts of the United States.” NBER Chapters, in: Measuring Distribution and Mobility of Income and Wealth, pp. 641-677, National Bureau of Economic Research. https://ideas.repec.org/h/nbr/nberch/14456.html
Bover, Olympia, Laura Crespo, Sandra García-Uribe Marina Gómez-García, Paloma Urcelay and Pilar Velilla (2024). “Micro and macro data on household wealth, income and expenditure: comparing the Spanish Survey of Household Finances (EFF) to other statistical sources.” Documentos Ocasionales, 2407, Banco de España. https://www.bde.es/f/webbe/SES/Secciones/Publicaciones/PublicacionesSeriadas/DocumentosOcasionales/24/Files/do2407e.pdf
García-Vaquero, Victor, and Irene Roibás. (2020). “Recent developments in real estate investment trusts in Spain”. Economic Bulletin – Banco de España, 3/2020, Analytical Articles. https://repositorio.bde.es/handle/123456789/13482
Kavonius, Ilja K., and Juha Honkkila. (2013). “Reconciling micro and macro data on household wealth: A test based on three euro area countries”. Journal of Economic & Social Policy, Vol. 15(2), pp. 42-73. https://tuhat.helsinki.fi/ws/portalfiles/portal/156987267/article_wealth.pdf
Pfeffer, Fabian T., Robert F. Schoeni, Arthur Kennickell and Patricia Andreski. (2016). “Measuring wealth and wealth inequality: Comparing two US surveys”. Journal of Economic and Social Measurement, Vol. 41(2), pp.103-120. https://doi.org/10.3233/JEM-160421
Rothbaum, Jonathan L. (2015). “Comparing Income Aggregates: How do the CPS and ACS Match the National Income and Product Accounts, 2007-2012”. US Census Bureau, SEHSD Working Paper, 1. https://www.census.gov/content/dam/Census/library/working-papers/2015/demo/SEHSD-WP2015-01.pdf
The EFF is a large-scale household survey that has been conducted by the Banco de España since 2002, providing detailed information on the income, assets, debt and spending of households living in Spain. See Barceló, Crespo, García-Uribe, Gento, Gómez and de Quinto (2020) for further details on the contents and methodological aspects of the survey.
In 2020 the EFF was changed to a biennial survey.
This is a summary of a comprehensive document that analyzes and compares more variables and ratios, for further details, please see Bover et al. (2024).
For the other micro surveys (EU-SILC and HBS) the reference period is the entire year.
The question in EFF about non-durable goods is: “What is your household’s total average spending on consumer goods in a month including food? Consider all household expenses such as electricity, water, mobile phones, condominium services, leisure, school/university, travel, etc. This excludes spending on durable goods, such as automobiles, domestic appliances and furniture, as well as rent, insurance, mortgage payments, etc.”