We use a meta-analysis to quantify the impact of misallocation of production factors on aggregate productivity. A key estimate in empirical studies on misallocation is the implied aggregate total factor productivity (TFP) loss due to the sub-optimal allocation of resources across firms. In our meta-analysis, we correlate this effect size with various study characteristics. First, we find that the TFP growth effect size is smaller than the level effect size. Second, we make a distinction between studies following a direct or indirect approach, where the former relates misallocation to one or more specific factors while the latter quantifies the overall effect of all possible sources. We find that studies following a direct approach generally report a smaller TFP loss than those using an indirect approach. Third, we find that the extent of misallocation and the corresponding productivity loss depends on the country of analysis.
Misallocation of production factors has been the dominant explanation of productivity differences across countries (Hsieh and Klenow, 2009; Bartelsman et al, 2013; Jones, 2016). Misallocation occurs when there are distortions that affect the allocation of production factors, i.e. capital and labor, across heterogeneous producers of the same good. Some firms are taxed while others may be subsidized. In this context, misallocation of production factors results in a lower aggregate productivity level because the economy does not operate at the efficient frontier. Misallocation at the level of the firm is especially harmful for aggregate productivity when it is correlated with the level of firm level productivity (Restuccia and Rogerson, 2008).
Many countries have experienced an aggregate productivity slowdown in the last decades. The observed increase in misallocation over time could be an important factor behind the declining Total Factor Productivity (TFP) growth rates. Recent studies have shown that empirical measures of misallocation, based on the dispersion in marginal revenue products, have increased over time within countries (Gamberoni et al, 2016; Gopinath, 2017; among others). In this study we carry out a meta-analysis of the extensive empirical literature quantifying the TFP impact of misallocation. The key estimate in empirical studies on misallocation is the TFP loss due to misallocation. This loss is calculated by comparing realized TFP with a counterfactual efficient TFP in an economy without input factor distortions. The analysis facilitates the assessment of the “true” impact of misallocation on TFP growth. By “true” we refer to the average impact found in empirical studies after controlling for all characteristics of those studies that might bias the result. In our meta-analysis we quantify both the differences between countries and development over time.
We collect estimates of misallocation from 72 primary studies, where the effect size is measured by the reported TFP loss. This TFP loss is calculated by comparing realized TFP with a counterfactual efficient TFP in an economy without input factor distortions. Some studies report an estimated level of TFP loss for the study period, while others focus on the growth rate of TFP over time. Here, we distinguish the level and growth effects of misallocation, and report our results on both accounts. The primary studies have been published over the period 2008-2022. The number of estimates of the TFP loss per study varies from 1 to 187, with a total of 1786 observations.
We correlate the TFP loss estimates with study characteristics to explore which of the characteristics of the empirical analyses are most important and relevant. We take into account intra-study correlation of reported effect size by a random effects panel data model. We assume that due to unobserved heterogeneity, each primary study has its own effect size, which by itself is a random draw of an underlying distribution.
In Figure 1, we provide a funnel plot to examine the presence of potential small study biases in our database. The funnel plot suggests that some studies in our sample report large misallocation effect sizes relative to their standard error, which could indicate some evidence of publication bias as large TFP losses are over-represented in the data. This could also be a result of heterogeneity across study characteristics, which we explore next with our meta-regression analysis to explain why the estimated TFP loss varies within and between primary studies. We follow as much as possible the best available practices for meta-analysis as described by Havranek et al. (2020). We distinguish the following potentially relevant study characteristics: (1) benchmark TFP (average effect size); (2) direct and indirect approach; (3) country/area characteristics; (4) year of publication; (5) nuisance parameters.
Figure 1: Misallocation estimates and publication bias
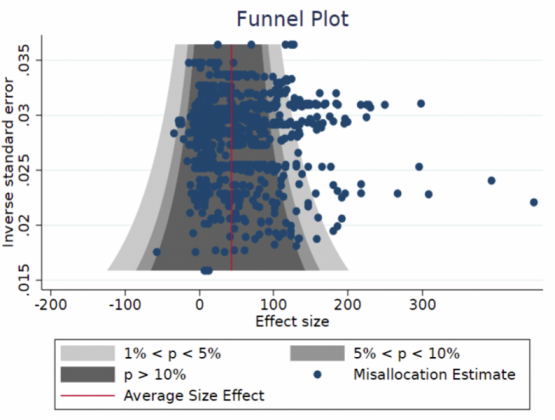
Note: Misallocation estimates (effect size) are on the horizontal axis and the vertical axis reports a measure of the (inverse) standard error for each estimate. The red line corresponds to the average size effect of 38.6%.
In this section we discuss the empirical results from estimating a random-effects meta regression. In Bun et al. (2023), we consider a number of specifications with different regressors to identify the effects of study characteristics. These include regressors for the average size effect, dummy variables for the growth effect size, direct vs. indirect approach, U.S. and Euro Area (EA) specific effect sizes, publication year, the elasticity of substitution as a nuisance parameter, per capita income, a composite macro index, and various categories of direct approaches.
The estimated average effect size of misallocation in our meta-regressions ranges between 38.60-70.65%. Given the fairly sizeable average effect size, our study aims at decomposing the effects of different study characteristics on misallocation. Tables 1 and 2 summarize the ranges of empirical results from estimating the meta regressions, which we discuss in further detail below.
Level vs. growth effect. In order to account for the difference between level and growth effect sizes in the primary studies, we include a dummy variable indicating whether the TFP loss is measured against a benchmark TFP level or compared to the TFP loss observed in a base year. Our results suggest that the growth effect size is smaller than the level effect size by 50.81 – 53.97% in our sample.
Direct vs. indirect approach. We make a distinction between studies following a direct or indirect approach. The former examines the effects of one or multiple factors on misallocation, while the latter quantifies the overall effects of all possible sources. Our baseline results suggest that the direct approach yields misallocation estimates that are smaller by 30.03-32.96%.
Country specific effects. The extent of misallocation and the corresponding inefficiency loss depends also on the country of analysis. In general, we expect low income countries to exhibit the largest TFP losses from misallocation. First, the literature has shown that TFP differences across countries are a large contributor to income differences. Second, low income countries usually have weaker institutions that prevent an efficient allocation of resources. To account for this effect, we first include two dummy variables for US and the EA respectively. Both coefficients are significantly negative (-26.58% and -14.37%), implying that misallocation in both US and the EA are smaller compared to the full sample average. Furthermore, misallocation in the US is smaller compared the EA. These results are in line with the often adopted view that the US is at the efficiency frontier.
Next we consider a more general approach and replace the US and the EA dummies with the per capita income. The results indicate that a 1% increase in per capita income is associated with a 6.96% reduction in misallocation. We also introduce a country-specific Macro Index, which is constructed with a principal components analysis using per capita income, the Gini coefficient, inflation and unemployment. We find that a 1% increase in this index is associated with an 8.12% reduction in misallocation. Both of these results support the view that lower income is generally associated with larger TFP losses due to misallocation.
Publication year and elasticity of substitution. The coefficient estimate on the publication year is generally negative, with the estimates ranges between -1.15-0.01%. This is in line with the view that the contribution of misallocation may have become smaller over time, though the sign is not robust across all specifications and the coefficient is usually insignificant. Lastly, we include the value of the substitution elasticity as a meta-regressor. The results show a relatively small effect. Increasing this nuisance parameter with one unit (e.g. from 3 to 4) changes the estimated TFP loss by 3.12-3.46 p.p. in Table 1. The sign of the estimated coefficient is in line with theory, i.e. in case of higher substitutability the impact of distortions on aggregate productivity is larger. Noting that in the data the minimum and maximum values are 1 and 10 respectively, its economic impact is small.
Table 1: The effect of various study characteristics (relative to the average effect size) in random effects meta- regressions. See Bun et al. (2023) for details about the underlying regression specifications.
| Study Characteristic | Full Sample – Estimated Effect on Misallocation (Relative to average effect size) |
| (1) Growth Effect Size | -50.81 – 53.97% |
| (2) Direct Approach | -30.03 – 32.96% |
| (3) U.S. | -26.58 – 33.05% |
| (4) Euro Area | -14.37 – 17.29% |
| (5) Per Capita Income | -6.96% |
| (6) Macro Index | -8.12% |
| (7) Publication Year | -1.15 – 0.01% |
| (8) Elasticity of Substitution | 3.12 – 3.46% |
Different sources of misallocation in direct studies. In our study, we also distinguish between different sources of misallocation among primary studies with the direct approach. We categorize the direct approaches in 6 main buckets: 1) financial frictions 2) mark-ups, 3) regulation, 4) uncertainty, 5) capital adjustment costs and 6) other sources (e.g. imperfect information or land distortions). Our findings on the effects of these categories are summarized in Table 2. We find that capital adjustment costs and uncertainty have the smallest impact on misallocation, which are lower by -58.50% and -55.88% compared to the indirect approach. As opposed to this, other sources and financial frictions have the highest impact, which are lower by only -23.81% and -36.94% compared to the indirect approach.
Table 2: Effects of different direct approach types (relative to average effect size) on misallocation.
| Direct Approach Type | Estimated Effect on Misallocation (Relative to indirect approach) |
| Financial Frictions | -36.94% |
| Markups | -41.94% |
| Regulation | -54.96% |
| Uncertainty | -55.88% |
| Capital Adjustment Costs | -58.50% |
| Other Sources | -23.81% |
Misallocation of production factors has been on the rise in the last decades. Our meta-analysis focuses on the correlation between the estimated TFP loss and primary study characteristics. First, we find that the productivity growth effect size is much smaller than the level effect size. Second, we distinguish between studies following the direct approach, which relates the extent of misallocation to one or more specific sources, and the indirect approach, which tries to quantify the overall effect of all possible sources. We find that on average, the indirect approach results in a larger productivity loss. Within the subset of primary studies using the direct approach, financial frictions, mark-ups and other sources (including imperfect information, misspecification, trade, etc.) are the most important, while capital adjustment costs and uncertainty have the lowest impact on misallocation. Third, we find that the extent of misallocation, as well as the corresponding productivity loss depend on the country of analysis. There is a negative correlation between the productivity loss due to misallocation and the level of income. Finally, we do not find a significant role for publication year.
Bartelsman, E., J. Haltiwanger, and S. Scarpetta (2013). Cross-country differences in productivity: The role of allocation and selection. American Economic Review 103 (1), 304–334.
Bun, M., Kolaiti, T., Ozden, T (2023). Misallocation and Productivity Growth: a Meta-analysis. De Nederlandsche Bank Working Paper No. 774.
Gamberoni, E., C. Giordano, and P. Lopez-Garcia (2016). Capital and labour (mis)allocation in the euro area: Some stylized facts and determinants. Working Paper Series 1981, European Central Bank.
Gopinath, G., S¸. Kalemli-Ozcan, L. Karabarbounis, and C. Villegas-Sanchez (2017). Capital allocation and productivity in south europe. The Quarterly Journal of Economics 132 (4), 1915–1967.
Havranek, T., T. D. Stanley, H. Doucouliagos, P. Bom, J. Geyer-Klingeberg, I. Iwasaki, W. R. Reed, K. Rost, and R. C. van Aert (2020). Reporting guidelines for meta-analysis in economics. Journal of Economic Surveys 34 (3), 469–475.
Hsieh, C. and P. J. Klenow (2009). Misallocation and manufacturing TFP in China and India. The Quarterly Journal of Economics 124 (4), 1403–1448.
Jones, C. (2016). The facts of economic growth. In Handbook of Macroeconomics, Volume 2, edited by John B. Taylor and Harald Uhlig, 3-69, North Holland.
Restuccia, D. and R. Rogerson (2008). Policy distortions and aggregate productivity with heterogeneous establishments. Review of Economic Dynamics 11 (4), 707–720.