This policy brief is based on European Central Bank Working Paper Series No. 2935. The views expressed are those of the authors and do not necessarily reflect those of the European Central Bank (ECB).
In this SUERF policy brief, we evaluate how the euro area economy would have performed since mid-2021 under alternative monetary policy strategies. We use the New Area-Wide Model (NAWMII)—the ECB’s workhorse estimated DSGE model for the euro area—to contrast actual policy conduct against alternative strategies including model-based optimal policy setting. In theory, if one assumes that the monetary authority had full knowledge of prevailing conditions from mid-2021 onwards, the alternative policy strategies would call for anticipated timing of the start of the hiking cycle. However, once we run the monetary policy counterfactuals on real-time vintages of data and projections, the alternative interest rate paths would be broadly consistent with the observed one. The proximity of some benchmark optimal policy counterfactuals with actual policy conduct over the period, brings further indication that the ECB succeeded in implementing an efficient management of the output-inflation trade-off.
In Darracq Paries, Kornprobst and Priftis (2024) (DKP24), we attempt to assess the impact of ECB monetary policy on macroeconomic outcomes by focusing on changes to interest rate policy in the post-pandemic environment. To do so, we employ the New Area-Wide Model (Coenen et al., 2018), the workhorse DSGE model for policy analysis at the ECB (Ciccarelli et al, 2024), and confront it with alternative, counterfactual monetary policy strategies since mid-2021. Our intention is to contrast the impact of actual policy against alternative strategies that differ in their timing, optimality, and reflection of monetary policymaker preferences, using a state-of-the-art DSGE policy model tailored to provide quantitative prescriptions regarding euro area monetary policy.1
Using as benchmark the official macroeconomic projections by the ECB and the Eurosystem, we employ the NAWM II to simulate the effects on GDP growth and inflation under a strategy where interest rate policy follows the estimated Taylor-type rule of the model, at different points in time.2 This counterfactual enables to answer the question of whether the timing of the interest rate hiking cycle matters. In particular, what would have happened to interest rates, output, and inflation had the ECB followed the estimated interest rate rule of the model since 2021Q4 – when inflation rose to 4.7% and began to significantly overshoot the target – as opposed to maintaining the lower-for-longer policy until 2022Q2 and raising interest rates thereafter. Specifically, the rule-based projection is implemented by performing a conditional forecast, conditioning on all macroeconomic shocks other than the standard monetary policy shock.
The solid red lines in Figure 1 suggest that an earlier hike would have minimised the peak of inflation and achieved convergence to the target faster. Yet, the counterfactual exercise that begins in 2022Q3 (dashed red lines) delivers broadly similar outcomes to the actual policy conduct. The experiment therefore suggests that the interest rate rule of the NAWM II tracks relatively well observed policy from 2022Q3 to 2024Q1. Instead, a lower-for-longer policy that “looks-through” the full sequence of shocks (dotted red lines) whereby the policy rate is maintained at the lower bound until 2023Q4, would have taken economic activity significantly above potential between 2022Q2 and 2024Q2, and led to high and persistent inflation, which would have peaked around 10.5% and remained above 4% until 2025.
Figure 1. Rule-based and optimal policy projections since 2021Q4
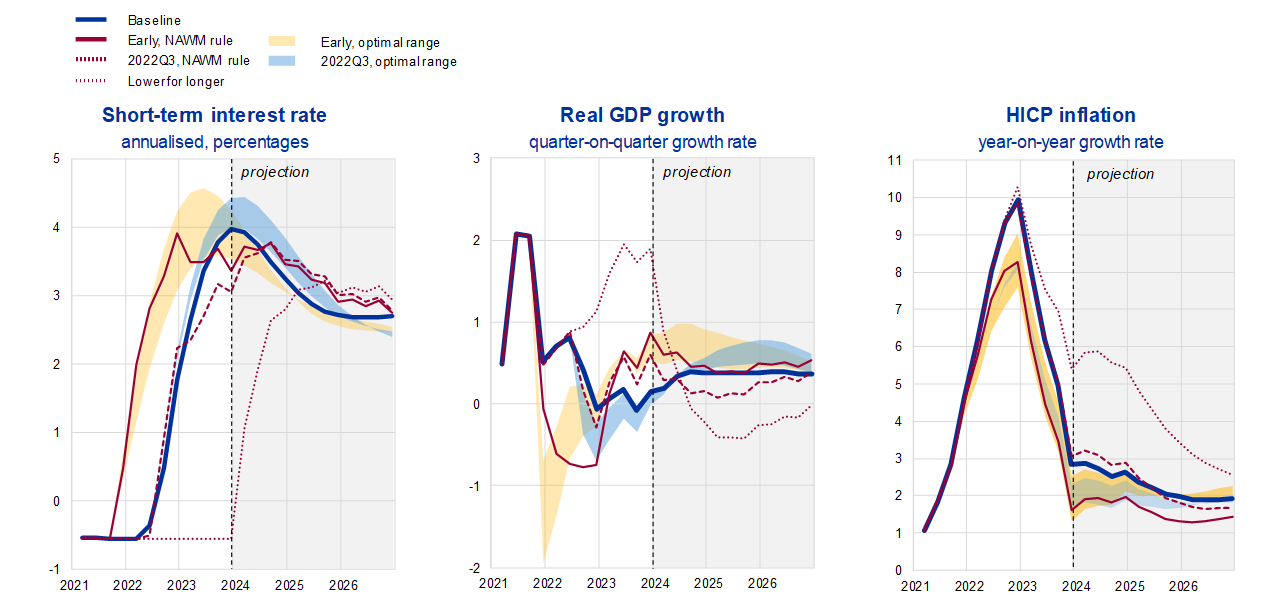
Note: This figure depicts counterfactual policies conditional on the December 2023 macroeconomic projection baseline (solid dark blue lines), in particular rule-based counterfactual policies whereby the ECB ended its lower-for longer policy and followed the historical reaction function since 2021Q4 (solid red lines), 2022Q3 (dashed red lines) or 2024Q1 (dotted red lines) or optimal policy counterfactuals at different points in time and under alternative parameterisations of the central bank loss function. The yellow shaded area represents the optimal policy range when initiated in 2021Q4 and the blue shaded area the optimal policy range when initiated in 2022Q3.
While the conditional forecasts with the estimated interest rate rule of the model allows gauging the effects of alternative starting dates of the hiking cycle, we also investigate the effects on the euro area economy of optimal monetary policy conduct, designed to minimize a central bank intertemporal loss function consistent with price stability orientation over the medium term as in Mazelis et al. (2023).3
The ranges in Figure 1 show that, compared to the rule-based projections, optimal policy projections are more hump-shaped, with higher peak rates but less persistence of the restrictive stance. Once assuming the 2022Q3 lift-off date (shaded blue ranges), the benchmark preferences would engineer a mild recession and deliver inflation outcomes quite similar to the baseline. Conversely, more hawkish preferences would imply a deeper recession and inflation undershooting the target by 2024 already.4
We simulate policy counterfactuals in real time to assess the respective role of “bad luck” (i.e., one-sided repeated adverse shocks hitting the euro area economy) and “bad policy” (i.e., delayed adjustment of monetary policy stance and the management of the output-inflation trade-off compared with alternative monetary policy conduct) in shaping macroeconomic outcomes since 2021Q4. In this setting, policy counterfactuals are updated each quarter between 2021Q4 and 2024Q1, reflecting new vintages of incoming data and macroeconomic projections.
Figure 2 illustrates the comparison between actual policy and real-time staggered policy setting, using either the interest rate rule of the model (blue diamonds), or optimal policy with benchmark (yellow diamonds) and hawkish (red diamonds) preferences. Overall, real-time simulations confirm that actual policy fares relatively well against alternative policy conducts. In particular, the actual rate path aligns more closely with real-time optimal policy projections than with the model’s estimated interest rate rule.
Figure 2. One-quarter ahead real-time interest rate policy prescriptions
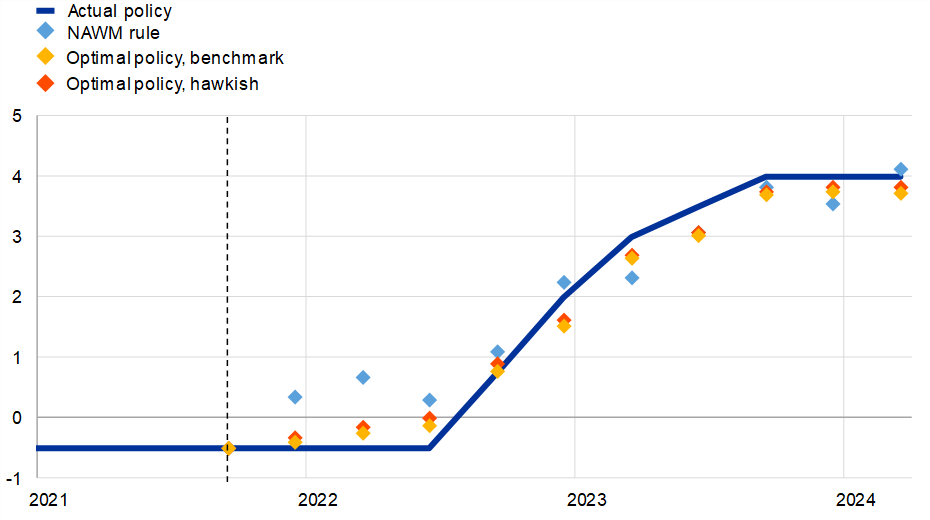
Note: This figure depicts policy under staggered real-time information about macroeconomic conditions between 2021Q4 and 2024Q1. Policy projections are updated every quarter with the vintage of the relevant projection baseline (December 2021, March 2022, June 2022, September 2022, December 2022, March 2023, June 2023, September 2023, December 2023 and March 2024) by finding the policy path that is consistent with the feedback rule of the model while the optimal policy paths are computed by minimizing a central bank loss function as in DKP24. In DKP24, the chart depicts the policy paths relative to the 3-month Euribor. For presentation purposes here, the baseline and alternative paths are adjusted by the DFR-ERB3M spread, and “actual policy” corresponds to the deposit facility rate (DFR).
Unlike in simulations with hindsight about the sequence of shocks hitting the economy between 2021Q4 and 2023Q4, in real time there is no strong rationale for hiking policy rates aggressively already in 2022Q1. Optimal policy projections in real time from 2021Q4 would even indicate a slower tightening pace than what the model’s interest rate rule would suggest. Instead, real-time prescriptions call for a less steep interest rate increase, which is however more persistent than in the full-information counterfactuals. While policy rate normalisation appears to have been delayed in comparison to these real-time projections, larger rate increments have at least partially counterbalanced the initial easing impulse.
We also provide synthetic indicators of macroeconomic volatility and welfare implied by each strategy. Our focus is on measuring the square root of the sum of squared deviations of relevant variables from their respective targets over the period 2022Q1-2026Q4. For the evaluation in real-time, we take the average of such measures over the quarterly macroeconomic and policy projections vintages from 2021Q4 to 2023Q4.
Table 1. Macroeconomic volatility and welfare with alternative strategies in real time
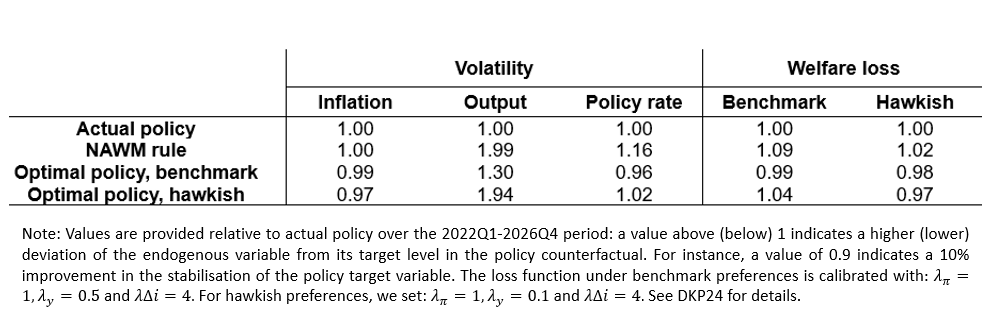
Overall, the forceful monetary tightening by the ECB since 2022Q3 seems well-vindicated by the battery of monetary policy experiments conducted with the NAWMII: real-time counterfactual policies, based on the information set and quarterly projections available at each point in time, clearly indicate that actual policy succeeded in implementing an efficient management of the output-inflation trade-off. Of course, the validity of our findings relies on the validity of the model itself. There is considerable uncertainty around several aspects of our analysis, notably related to the specification of policymaker preferences, the strength of monetary policy transmission mechanism or the expectations formation process of economic agents. We trust that the inflation surge period will become an engaging playground for further research in these fields.
Ciccarelli, M., Darracq Pariès, M., Priftis, R., Angelini, E., Bańbura, M., Bokan, N., Fagan, G., Gumiel, J.E., Kornprobst, A., Lalik, M., Montes-Galdón, C., Müller, G., Paredes, J., Santoro, S.,Warne, A., Zimic, S., Rigato, R., Kase, H., Koutsoulis, I. Brunotte, S., Cocchi, S., Giammaria, A., Invernizzi, M. and Von-Pine, E., 2024. “ECB macroeconometric models for forecasting and policy analysis”, Occasional Paper Series 344, European Central Bank.
Coenen, G., Karadi, P., Schmidt, S. and Warne, A., 2018. “The New Area-Wide Model II: an extended version of the ECB’s micro-founded model for forecasting and policy analysis with a financial sector“, Working Paper Series 2200, European Central Bank.
Darracq Pariès, M., Kornprobst, A. and Priftis, R., 2024. “Monetary policy strategies to navigate post-pandemic inflation: an assessment using the ECB’s New Area-Wide Model,” Working Paper Series 2935, European Central Bank.
de Groot, O., Mazelis, F., Motto, R., Ristiniemi, A., 2022. “A toolkit for computing Constrained Optimal Policy Projections (COPPs)“, CEPR Discussion Papers 16865, C.E.P.R. Discussion Papers.
Lane, P. R., 2024, “The analytics of the monetary policy tightening cycle”, Guest lecture at Stanford Graduate School of Business
Mazelis, F., Motto, R., Ristiniemi, A., 2023. “Monetary policy strategies for the euro area: optimal rules in the presence of the ELB“, Working Paper Series 2797, European Central Bank.
See the speech by P. Lane on 02/05/24 for a discussion of the merits of counterfactual analysis to gauge the effectiveness of monetary policy, as well as additional details on monetary policy strategies in the post-pandemic inflation period based on applications from DKP24 and Mazelis, Motto, and Ristiniemi (2023).
For an extended overview of model-based applications related to ECB and Eurosystem projections see, Ciccarelli et al, 2024.
Methodologically, our approach follows a constrained optimal policy projection as in de Groot et al. (2021).
Compared to the case where the short-term interest rate is the sole monetary policy instrument, our analysis suggests that a jointly optimal policy conduct, starting in 2022Q3, for both interest rate and central bank asset purchases would imply a faster unwinding of the central bank balance sheet and lower policy rate by around 10 basis points throughout the simulation horizon. The optimal combination of policy instruments would only marginally improve on the macroeconomic allocation. Indeed, within the confines of this model-based counterfactual, the policy rate turns out to be the primary instrument to manage the inflation surge episode.