We consider the pass-through of different ECB monetary policy measures to bank corporate lending rates of different maturities during 2010–2020. We find changes in the pass-through as policy rates first dip below zero in 2014 and again when negative interest rates become more persistent during the “low-for-long” period beginning in 2016. Overall, the transmission of monetary policy to bank lending rates appears to have become less efficient below zero, particularly in the case of corporate loans with short maturities. We are the first to empirically identify reversal in the pass-through during the low-for-long period with banks raising their lending rates as monetary policy is eased. Unconventional monetary policy measures such as targeted longer-term refinancing operations appear to have mitigated these contractionary effects.
Ulate (2021) proposes a dual mechanism whereby policy rate cuts exert downward pressure on loan rates (bank lending channel) and reduce bank profitability and equity (net worth channel). Whether lending rates actually fall after a policy rate cut is dictated by the relative importance of these two channels. Abadi, Brunnermeier, and Koby (2023) model two channels that following a policy rate cut affect bank net worth. Banks make capital gains on their long-term assets (capital gains channel). As interest rates head lower, the pass-through from policy rates to deposit rates decline, compressing the profit margins of banks (net interest income channel). The reversal rate is the rate below which the net interest income effect of further interest rate cuts outweighs the capital gains effect. The level of the reversal rate decreases with the maturity of fixed-income assets held by banks. When banks have greater maturity mismatch, the capital gains channel is stronger relative to the net interest income channel, and the reversal rate is lower. Further, if central bank promises to keep interest rates at low levels for a prolonged period with forward guidance, it is bound to become counterproductive over time even if its initial response is to boost lending (Abadi, Brunnermeier, and Koby, 2023).
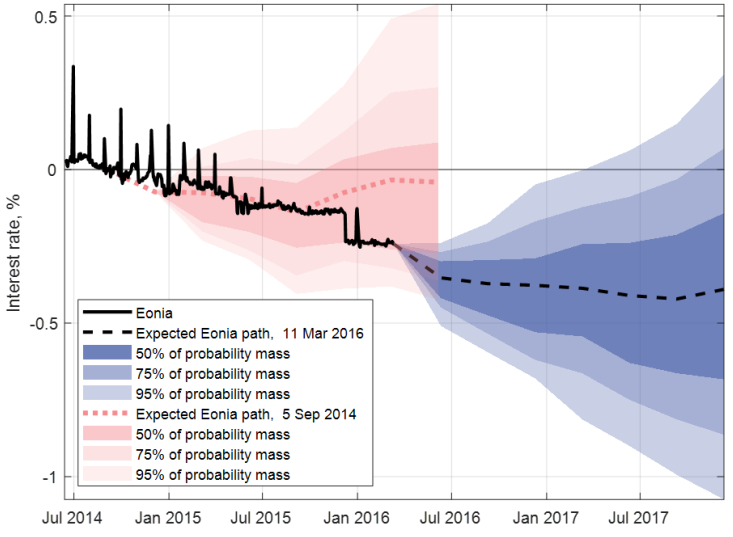
Figure 1: Expected Eonia paths (forward rates) and their probability distributions derived from interest rate options.
See Table 4 in Balloch et al. (2022) for details concerning the data used in existing empirical studies.