menu
close

Author(s):

Martin Mandler | Deutsche Bundesbank
Michael Scharnagl | Deutsche Bundesbank

Keywords:

money growth , inflation , wavelet analysis

JEL Codes:

C30 , E31 , E40
Understanding the relationship between money growth and inflation has a long history both in economic theory and empirical analyses. Our wavelet analysis of this relationship at low frequencies in the euro area shows that it has weakened over the 1990s. However, we find evidence of stable co-movement between money growth adjusted for real GDP growth and inflation for cycles of 24 years and longer duration. The corresponding long-run fluctuations move roughly about one-to-one and without economically significant time lags (no lead of money growth). However, due to limitations inherent in our wavelet-based approach our analysis does not provide information on recent developments.

1. Introduction

The quantity theory of money predicts a stable long-run one-to-one relationship between the growth rate of the money supply and the inflation rate. However, empirical analyses suggest that there is strong variation in the relationship between money growth and inflation over time.
This relationship has been analysed using a variety of approaches. In an early analysis, Lucas (1980) used moving averages of money growth and inflation for the US computed within the time period from 1953 to 1977 and estimated a slope coefficient close to unity. In a sample of 160 countries, DeGrauwe and Polan (2005) found no significant relationship between money growth and inflation when money growth is low (below 15%) in a regression based on long-term averages. Similar results for inflation rates below 12 % were obtained by Teles et al. (2016) for OECD countries. They show that the fit of the regression can be improved when correcting money growth for GDP growth and interest rate effects applying theory-based elasticities. For countries pursuing inflation targeting the correlation between both variables tends towards zero.
Sargent and Surico (2011) apply a frequency decomposition to the estimated parameters of a time-varying vector autoregressive model for the US from 1875 to 2005, controlling for GDP growth and interest rates. They find instability in the low-frequency relationship between money growth and inflation and attribute this variation to changes in monetary policy (based on simulations of a DSGE model).
Benati (2009) used spectral analysis and accounted for possible changes in the relationship between money growth and inflation by using rolling windows. He showed coherency between these variables to be stable over time in many countries, i.e. that there have been common movements in long-run money growth and inflation. However, time variation in the gain, which can be interpreted as a regression coefficient, was quite substantial. In his explanation episodes with a low gain occur when money demand shocks are the dominant driver of trend money growth. In a more recent analysis Benati (2021) applied the concept of long-run covariability to assess the relationship between long-run fluctuations in money growth and inflation in 17 economies, focussing on cycles with periods beyond approximately 30 years. The evidence of a one-to-one relation diminishes after 1985.
In Mandler and Scharnagl (2014) we applied techniques from wavelet analysis to quarterly euro area data from 1970 to 2012. The results indicated a strong co-movement close to a one-to-one relationship in particular in the low-frequency band of 24 to 32 years where money growth is leading inflation but show the co-movement to weaken during the 1990s for medium-to-long run fluctuations.
Recently, we updated our analysis using a sample up to the second quarter of 2022 (Mandler and Scharnagl, 2023). This allows us to investigate the relationship between money growth and inflation in the euro area over a longer period of time and at lower frequencies.1 In this policy brief we present a summary of our results.

2. Methodology

Wavelet analysis as a form of spectral analysis decomposes time series into cyclical components of different frequencies. Whereas standard tools of spectral analysis assume stationarity of time series, wavelet analysis relies on flexible periodic functions (wavelets) with finite support. These wavelets can be adapted to different frequencies by stretching and widening their support. Shifting the wavelet over time allows for time variation.2 Our analysis is based on the so called Morlet wavelet which is widely used in economic applications.
In our analysis we focus on three statistics: (i) Wavelet coherency is a measure of the time- and frequency-specific local correlation of money growth and inflation. (ii) The frequency-dependent cross-spectral gain can be interpreted as the coefficient of a regression of inflation on money growth at a specific frequency or within a specific frequency band and at a specific point in time. (iii) The time lag is based on the time- and frequency- dependent phase difference of the series and shows for each frequency and at each point in time whether money growth is leading or lagging inflation.

3. Results

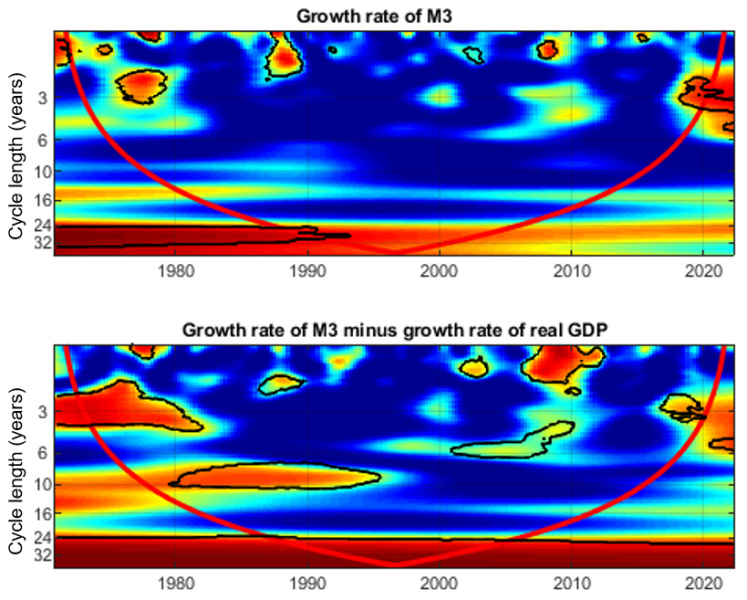
Figure 1 shows the estimated coherency between the annual growth rate of money (M3) and HICP inflation. Coherency varies between zero (dark blue) and one (dark red). The results below the curved red lines (cone of influence) are affected by start- and end-point problems and should not be interpreted. The areas within black lines highlight time-frequency combinations for which coherency is significantly different from zero. The upper part of the Figure shows the results for the annual growth rate of M3, the lower part for an adjusted measure of money growth (M3-GDPR) that is obtained by subtracting the annual growth rate of real GDP from the annual growth rate of M3. This adjustment follows Teles et al. (2016) and Gao et al. (2021). It is based on the intuition that rearranging the quantity equation shows that, for a given velocity of money, fluctuations in inflation should be related to fluctuations in excess money growth, i.e. money growth minus real output growth.
Figure 1: Heatmap of correlation between money growth and consumer price inflation in the euro area as measured by wavelet coherency
 width=
Note: Heatmap of wavelet coherency, which can be interpreted as a time and cycle-length dependent measure of correlation. Correlation rises from zero (dark blue) to one (dark red). Black lines surround episodes and cycle lengths with coherency different from zero at the 5% significance level. Results below the curved red lines suffer from start- or end-point problems and are less reliable.
Between the end of the 1980s and the early 2000s, we find a strong and stable correlation between cycles of the annual growth rate of adjusted M3 growth and inflation for cycles with a length of 24 years and above. For headline M3 the correlation in this frequency band is less stable, declines in the early 1990s and becomes insignificant. In the other frequency ranges the correlation is generally much smaller and not significant, except for short subsamples for the adjusted money growth measure.
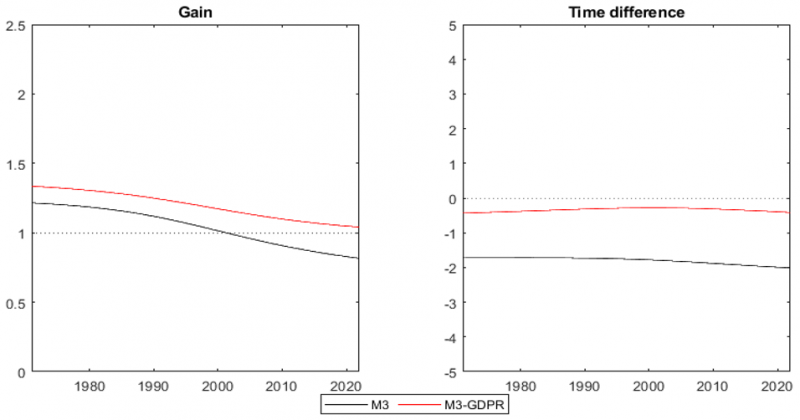
Figure 2: Cross-spectral gain and time difference 
 width=
Figure 2 (left panel) shows the frequency-specific cross-spectral gains for cycles of periods between 24 and 32 years, i.e. cycles for which Figure 1 indicated coherency close to one for M3-GDPR and a large but declining coherency for headline M3. For both definitions of money growth cross-spectral gains are close to unity, although slightly decreasing over time. Figure 1 shows significant correlation between six-to-ten year cycles in adjusted money growth and inflation from 1980 to the early 1990s. The gain of these cycles (not shown) starts at similar values as in Figure 2 but declines faster and is below one in the mid-1990s.
The right panel in Figure 2 displays the frequency-specific time differences between cycles in money growth and inflation. The vertical axis shows the time difference in years averaged over results for cycles lasting between 24 and 32 years – the cycle durations for which Figure 1 indicated significant coherency. If the time difference is negative, money growth is leading inflation. In the right panel of Figure 2 the adjusted growth rate of M3 is leading inflation by about one quarter. The estimated lead of headline M3 growth is about two years. However, it has to be kept in mind that the co-movement between M3 growth rate and inflation is strongly reduced after the mid-1990s in Figure 1.
One limitation of our wavelet analysis is due to the fact the wavelet functions into which each time series is decomposed are symmetric: At each point in time the estimation includes past data as well as future observations, and this “window” becomes wider as the duration of the cycles increases. This reflects in the shrinking of the area between the curved red lines as when moving downward in Figure 1. As can be seen in the Figure, this implies that the time period for which we can interpret our results concerning the relatively long cycles for which coherency is large is relatively short and does not go up to recent times.

References

Aguiar-Conraria, L. and Soares, M. (2014). The continuous wavelet transform. Journal of Economic Surveys 28: 344-375.
Benati, L. (2009). Long run evidence on money growth and inflation. European Central Bank Working Paper 1027.
Benati, L. (2021). Long-run evidence on the quantity of money. Discussion Paper 21-10, University of Bern.
DeGrauwe, P. and Polan, M. (2005). Is inflation always and everywhere a monetary phenomenon? Scandinavian Journal of Economics 107: 239-259.
Deutsche Bundesbank (2019). Financial cycles in the euro area. Monthly Report January, 51-74.
Gao, H., Kulish, M. and Nicolini, J. (2021). Two illustrations of the quantity theory of money reloaded. Federal Reserve Bank of Minneapolis, Staff Report No. 633.
Lucas, R. (1980). Two illustrations of the quantity theory of money. American Economic Review 70(5): 1005-1014.
Mandler, M. and Scharnagl, M. (2014). Money growth and consumer price inflation in the euro area: A wavelet analysis. Deutsche Bundesbank Discussion Paper 33/2014.
Mandler, M. and Scharnagl, M. (2023). Money growth and consumer price inflation in the euro area: An update. Deutsche Bundesbank Technical Paper 01/2023.
Rua, A. (2012). Money growth and inflation in the euro area: A time-frequency approach. Oxford Bulletin of Economics and Statistics 74(6): 875-885.
Sargent, T. and Surico, P. (2011). Two illustrations of the quantity theory of money: Breakdowns and revivals. American Economic Review 111: 109-128.
Teles, P., Uhlig, H. and Valle e Azevedo, J. (2016). Is quantity theory still alive? Economic Journal 126: 442-464.
  • 1.

    We also modify the bootstrap algorithm for significance testing to account for potential heteroscedasticity

  • 2.

    For an introduction to wavelet analysis, see e.g. Aguiar-Conraria and Soares (2014), Deutsche Bundesbank (2019), pp. 71 or Rua (2012). 

About the authors

Martin Mandler

Martin Mandler is a Senior Economist in the Monetary Policy and Analysis Division of the Deutsche Bundesbank. He is also teaching economics at Justus-Liebig-Universität Gießen and the Bundesbank’s University of Applied Sciences in Hachenburg. He holds a doctorate and a habilitation degree from Justus-Liebig-Universität Gießen. His main fields of interest are monetary economics, macroeconomics and applied time-series econometrics.

Michael Scharnagl

Michael Scharnagl is a Senior Economist in the Research Centre of the Deutsche Bundesbank. His main fields of interest are time series econometrics and monetary economics.

More on these topics

Tags: