The COVID-19 crisis has required monitoring economic activity in real time, a feature that usual data could not provide. High-frequency data, such as electricity consumption and bank card transactions, have made it possible to estimate the magnitude of the shock and the timing of the rebound at an early stage, for both industrial production and household consumption.
Chart 1: Impact of the health crisis on household consumption and firms’ electricity consumption (%)

Note: Deviation from a normal level (households) or from the historical average (firms). Household consumption is estimated using bank card transactions. Electricity consumption is adjusted for temperatures and working days.
The health crisis and lockdown measures have led to an unprecedented drop in economic activity in France. In this context it was important to monitor activity in real time. However, the data traditionally used for short-term analysis and forecasting (surveys, industrial production, consumption of goods) were not sufficient, since it is only available at a monthly frequency with publication dates ranging from the end of the current month to 40 days later. High-frequency data, such as firms’ electricity consumption and bank card transactions, have provided additional and quickly available information, and helped to refine the conjunctural assessment of current developments. In particular, it has made it possible to both estimate the magnitude of the shock and identify a decoupling of supply and demand at a very early stage: while productive activity began a gradual return to its normal level at the beginning of April, household consumption remained persistently subdued until the end of lockdown (see Chart 1).
Electricity is used intensively by companies as part of their production process and represents an indispensable intermediate consumption. This makes power consumption a good proxy of production to monitor corporate activity in almost real time, with a lag of one or two weeks.
The data require several processing operations. They are adjusted for calendar effects (weekends, holidays and long weekends) as well as temperature variations that affect the use of heating and air-conditioning irrespective of production activity (see Chart 2a). The resulting series are smoothed over seven days to eliminate residual calendar effects and are compared to their historical average (the corresponding days over the available past years).
Chart 2b shows changes in total and firms’ electricity consumption, as a deviation from the historical average. At the beginning of March, the series obtained were close to their historical average. With the implementation of lockdown measures, electricity consumption fell very sharply in the last two weeks of March, reaching a low of around -27% at the end of March. After this trough, electricity consumption followed a “bird’s wing” profile. It gradually recovered as of the beginning of April, showing that companies were able to adapt their production process to the health constraints even before the end of lockdown. But the rebound has only been very slow and partial: in early September, electricity consumption still remains around 5% below its historical average.
Chart 2: Electricity consumption
| a. Total consumption and temperatures | b. Deviation from the historical average (%) |
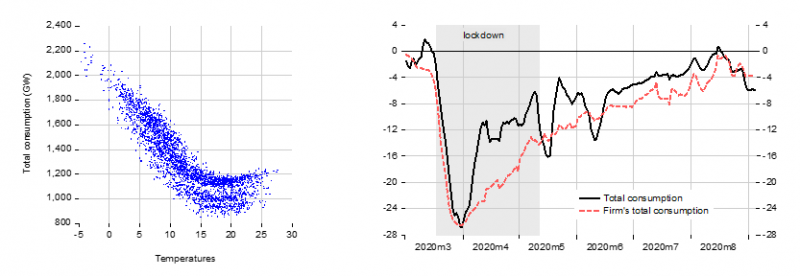
Sources: RTE and Enedis (electricity consumption), Météo France (temperatures); adjustment of temperatures and working days by the authors.
Note: At 31 March, total electricity consumption was down 27% compared to its historical average.
Lockdown measures as of 17 March, together with retail store closures, have subdued household consumption and altered its composition. In order to estimate in real time the impact of lockdown on household consumption, we used data on daily bank card transactions and withdrawals, provided with a lag of around 10 days by the Groupement des Cartes Bancaires CB (CB Bank Cards Consortium), based on a significant sample of the total transactions carried out. Using the breakdown by type of activity, we studied the distortion of consumption and monitored the activity of some specific sectors, in particular among services. For some consumer items, such as car purchases, card payments are marginal or unrepresentative, so we used alternative sources or expert
judgement.
The blue bars in Chart 1 represent the changes in total consumption obtained as a deviation from a normal situation (which corresponds to the trend observed before lockdown). The health crisis has had a very significant impact on consumer habits. While there was an increase in purchases during the second week of March, driven in particular by food purchases, lockdown caused a sharp fall in overall consumption, of around 30%, during the last two weeks of March. It then progressed slightly, but it wasn’t until the lifting of lockdown in the week of 11 May that it substantially improved. According to the latest data, at the beginning of September, household consumption is estimated to have recovered to its normal level.
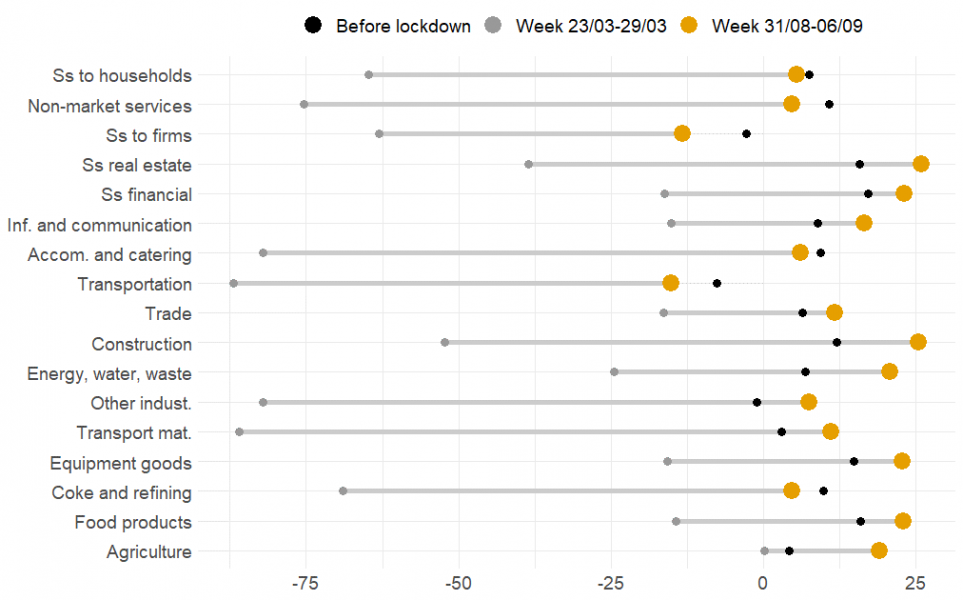
Chart 3 compares the year-on-year change in bank card transactions in different sectors for several time periods. At the start of lockdown, consumer spending fell in most sectors. Only retailers selling food, drinks, and alcohol showed a marked increase during this period, dampening the fall in the retailer sector. After the exit from lockdown, consumption in most goods producing sectors has returned to its pre-crisis level, or even above. However, some service activities, such as transports, have not yet fully recovered.
Chart 3: Household consumption by sector (year-on-year, %)
The use of high-frequency indicators in times of crisis
The use of this high-frequency data provided the Banque de France’s economists with an animated sequence of the current crisis, which enabled them to quickly determine the magnitude of the shock. It corroborated and contributed to the broader monthly snapshot of the French economic landscape published each month in our business assessment, which is based on the Banque de France monthly business survey. Although promising, the contribution of these high-frequency indicators for analysing and forecasting in normal periods has not yet been demonstrated. It represents nevertheless an interesting research path that today involves several French (Banque de France, INSEE, OFCE) and international (OECD) institutions.