This policy brief is based on Banque de France Working Paper No921. Working Papers reflect the opinions of the authors and do not necessarily express the views of the Banque de France or other institutions of affiliation.
The rise in inflation since 2021 could affect households’ and businesses’ perception of inflation. Our paper applies Natural Language Processing techniques (NLP) to the quasi-universe of newspaper articles for France, concentrating on the period 2004-2022, in order to measure inflation attention as well as perceptions by households and firms for that country. The indicator, constructed along the lines of a balance of opinions, is well correlated with actual HICP inflation. It also exhibits good forecasting properties for the European Commission survey on households’ inflation expectations, as well as overall HICP inflation. The method used is a supervised approach that performs better on our data than the Latent-Dirichlet-Allocation (LDA)-based approach of Angelico et al. (2022). The indicator can be used as an early real-time indicator of future inflation developments and expectations.
The price stability objective of central banks, and in particular the ECB, means that they must be able to assess not only current and future inflation developments but also the perception of inflation of economic agents. As regards current inflation, the consumer price indices published by national statistical institutes such as INSEE are closely analysed, be it for headline inflation, its components or measures excluding the most volatile items. Projections are also conducted to assess the inflationary or deflationary risks to the economy.
Maintaining price stability also requires that the inflation expectations of economic agents, households or companies, remain anchored around the inflation target set by the central bank. To measure inflation expectations, several indicators are used: i) expectations from financial markets, measured using inflation-linked bonds or inflation derivatives, ii) expectations of forecasters based on surveys (e.g. the Consensus Forecast or the Survey of Professional Forecasters), iii) expectations of companies (e.g. in France, the new survey of business leaders conducted by the Banque de France) and iv) expectations of households from surveys for example the European Commission’s consumer survey or the European Central Bank’s Consumer Expectations Survey (CES). The analysis in this post focuses on the way inflation is perceived through certain forms of media and the short-term expectations that can be derived from this.
The media disseminate a wealth of data that may reflect the inflation perceptions and expectations of households and businesses. This includes traditional media such as television, radio and print or social networks. In the case of the press, processing this volume of data requires the use of data science techniques that analyse qualitative textual data and transform them into quantitative figures that can be used by economists in the form of indicators.
A recent work in this area, carried out at the Banque de France on French data, collects and analyses more than one million articles from the written press since 2003 (source Factiva) to construct indicators of perceived inflation (in the spirit of the work of Angelico et al. (2022) for Italy using Twitter).
The method is based on the selection of articles using keywords (related to the semantic field of “inflation” or “prices”). Filtering and classification algorithms are used to select only those that actually deal with inflation and not other subjects (e.g. literary ‘prizes’) and to derive the direction of inflation/prices that may be mentioned in the text (rising, falling or stable). Extensions have also been explored, to exclude articles that might reflect the views of central banks themselves, and focus more on households.
Chart 1 shows the simple observation of the number of articles, which reveals interesting dynamics. After filtering, we get a first indicator of “inflation attention”, measuring periods were the press dedicates more space to inflation developments. While the number of relevant articles is correlated with the inflation cycle, we can observe different spikes in 2015-2016 while inflation was decreasing. There were actually signals in press articles highlighting lower pressures on inflation.
Chart 1: Monthly number of articles on price developments after filtering and HICP evolutions: Intensity indicator
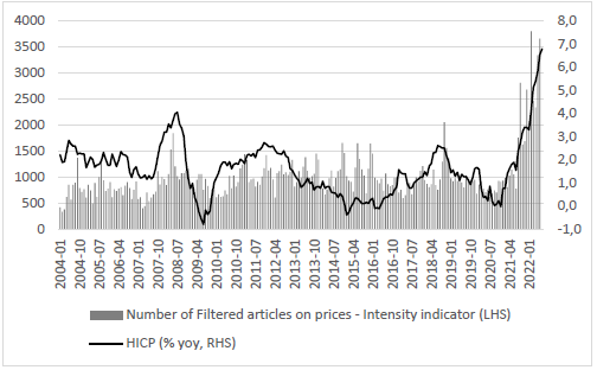
Sources: Factiva, Eurostat, authors’ calculations.
Other indicators, measuring the direction of price changes, are also calculated, based on the number of press articles mentioning a rise or fall in prices. These are “balances of opinion”, along the lines of business surveys, defined as (number of increases – number of decreases, or stability)/(total number of increases and decreases, or stability). These indicators can thus capture perceptions about current or future inflation. The Press indicator yields trends that are relatively close to those of observed HICP inflation and to the survey-based Household inflation expectations (see Charts 2.1 and 2.2).
Chart 2.1: Inflation Perception Press indicator (LHS) and HICP (%, y-o-y, RHS)
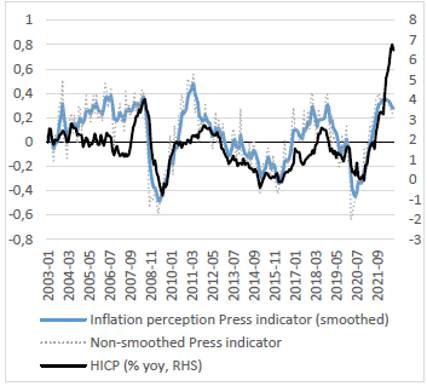
Sources: Factiva, Eurostat, European Commission, authors’ calculations.
Note: The Press and Household Survey indicators are constructed as opinion balances.
Chart 2.2: Inflation Perception Press indicator (LHS) and survey-based Household inflation expectations (1-year ahead, RHS)
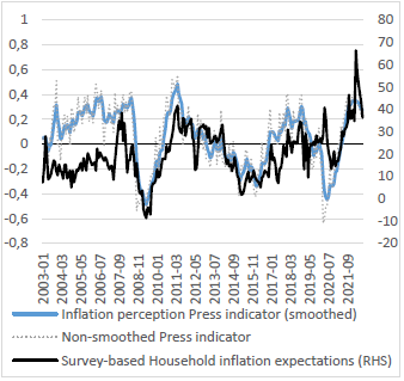
Sources: Factiva, Eurostat, European Commission, authors’ calculations.
Note: The Press and Household Survey indicators are constructed as opinion balances.
Simple correlation indicators point to a relatively high level of correlation over the sample April 2004 – August 2022 with HICP inflation and forecasts of professional forecasters (as given in the Consensus Forecast survey), respectively 77% for HICP and 67% for Consensus Forecast. Correlations seem a bit higher when benchmark inflation variables are taken with a lead, between 72% and 78%, signalling potential forecasting properties.
Forecasting properties of textual indicators are analysed, by implementing different sets of regressions, with households inflation expectations as a dependent variable. Besides textual indicators, explanatory variables include inflation from the Consensus Forecast survey, inflation-linked swaps and lagged HICP (harmonized index of consumer prices). Oil growth rates are also controlled for. Whether all variables are included, or only the most significant variables are selected with automatic selection algorithms, textual indicators are always the most significant variable, outperforming other traditional variables, as done in Angelico et al. (2022).
Using attention and directional indicators from the written press, inflation can be monitored on an infra-monthly basis, with rapidly available results (within a few days). The contribution of such indicators opens up interesting avenues of research on changes in the general inflation and price environment. For example, as shown by Korenok et al (2022), they could also help detect changes in the attention paid to inflation by economic agents.