This policy brief is based on ECB Working Paper Series, No 3004. The views expressed are those of the authors and do not necessarily reflect those of the ECB.
Abstract
This policy brief showcases a versatile toolbox that facilitates creation, evaluation, and deployment of nowcasting models. The toolbox supports three model classes (dynamic factor models, Bayesian VAR, bridge equations) and offers to manage data selection and adjusting for Covid-19 observations. The toolbox is organized along a structured three-step approach to building a nowcasting model. Non-specialists can easily follow these steps to develop high-performing models, while experts can leverage the automated tests and analyses. The toolbox produces a large range of outputs for regular policy analysis, aimed at opening the “black box” associated with nowcasts. We showcase the toolbox by creating and assessing a nowcasting model for global real GDP growth. Code and templates are available on GitHub: https://github.com/baptiste-meunier/Nowcasting_toolbox.
Nowcasting has emerged as an indispensable tool for policy institutions in need of early estimates of economic indicators, especially during episodes of crisis. However, creating a nowcasting model is often an arduous task. Moreover, as the economy evolves and new data sources becomes available, nowcasting models require periodic revisions to maintain accuracy. Finally, as any other tool used for policy purposes, nowcasting models should go beyond providing numbers and give an idea of the underlying forces driving model predictions.
Unfortunately, existing nowcasting tools do not offer a comprehensive toolkit that combines these functions in a unified infrastructure. We aim at addressing this limitation by designing a user-friendly and adaptable toolbox for building, refining, and deploying nowcasting models for policy analysis. The tool can be adapted to any mixed-frequency model with a quarterly target variable and a set of (many) potential regressors at monthly and quarterly frequencies. This work builds on a long-standing effort in the External Developments division of the ECB to design an adaptable and easy to use environment for model-based predictions, involving the work of many ECB colleagues. Compared with other codes available in the literature, this toolbox combines two main nowcasting duties under a single roof: building new nowcasting models from scratch and enhancing policy analysis through detailed insights into model-based predictions (Figure 1).
Figure 1. Schematic overview of main purposes of the nowcasting toolbox
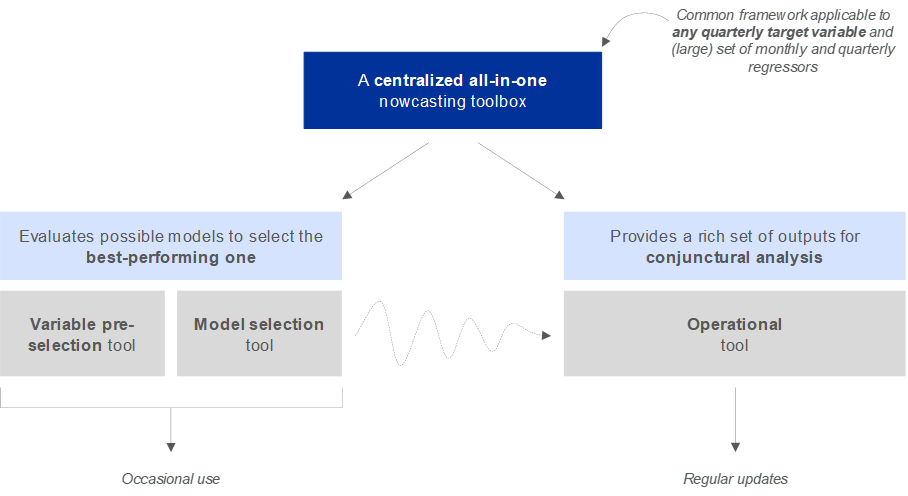
Sources: authors
The toolbox integrates various model classes and methods to manage data selection or adjust for Covid-19 observations. It supports three popular model classes: dynamic factor model (Bánbura and Modugno, 2014; Delle Chiaie et al., 2022), large Bayesian vector auto-regression (Cimadomo et al., 2022) and a combination of bridge equations à la Bánbura et al. (2023). The toolbox standardizes inputs and outputs for each model, allowing the user to switch easily across them. The toolbox also incorporates three pre-selection techniques (Efron et al., 2004; Bair et al., 2006; Fan and Lv, 2008) and three options for correcting for the Covid period (outlier correction, dummy variables, and deleting Covid-related observations). These various tools make the toolbox easily adaptable to various frameworks: it can notably accommodate for big data as it offers methods to pre-select the most informative regressors and model classes that work with many input variables.
While the nowcasting literature generally offers only limited intuition into how to build a model from scratch, one key contribution of the toolbox is to organize model creation along a structured three-step approach of variable pre-selection, model selection, and Covid robustness (Figure 2). This approach, which formalizes the steps generally followed by forecasters, offers a practical start-to-finish and step-by-step guide for non-specialists to create a tailored high-performing model. Specialists can still benefit from the automation and the flexibility of the toolbox.
Figure 2. The proposed three-step approach for building nowcasting models
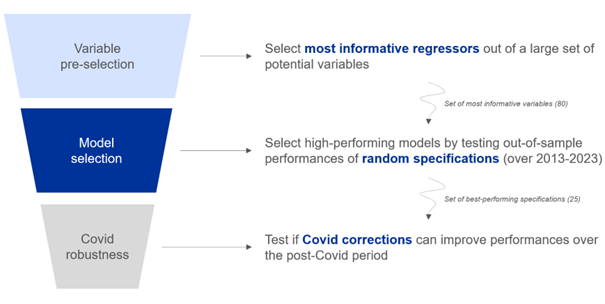
Sources: authors
We showcase the three-step approach by creating a model for quarterly global GDP growth and comparing it with an existing model, which was built on a more ad hoc procedure. Using the three-step procedure, we narrow down a large set of potential regressors to a set of most relevant predictors. The toolbox then handles the automatic testing of a large number of model specifications across the three model classes (DFM, BVAR, BEQ), randomizing over model parameters. Out-of-sample evaluation (on the 2013-2013 period) is handled by a pseudo real-time exercise, where the toolbox automatically reconstructs the “ragged edge” pattern of the data that a forecaster would have faced in real-time. Accuracy measures — specifically the Root Mean Squared Error (RMSE) and the Forecast Directional Accuracy (FDA) — are calculated based on these out-of-sample predictions. In our example, DFMs produced the best performing models. We therefore focus the rest of our exercise on DFMs and extracted the 25 best performing models. We then let the toolbox handle the final step – automatically testing whether corrections for the Covid period could further increase performances. Our final model utilizes outlier correction to adjust for the Covid period.
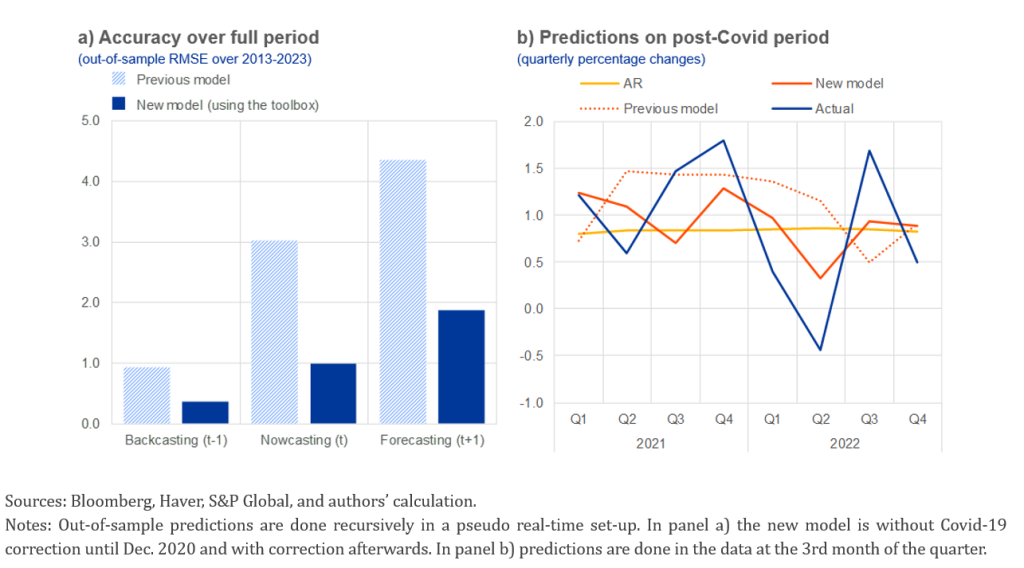
Overall, we were able to achieve a significant increase in prediction accuracy. Figure 3 (panel a) compares the point accuracy of the new model (from the toolbox) with the previous ad hoc model. Across all horizons, we achieve a significant reduction in out-of-sample RMSE over 2013-2023. Figure 3 (panel b) compares nowcasts over the post-Covid period with the actual outcome. The new model tracks the movements of global GDP growth much more accurately than the previous model and the naïve AR benchmark.
Figure 3. Accuracy of the best-performing model
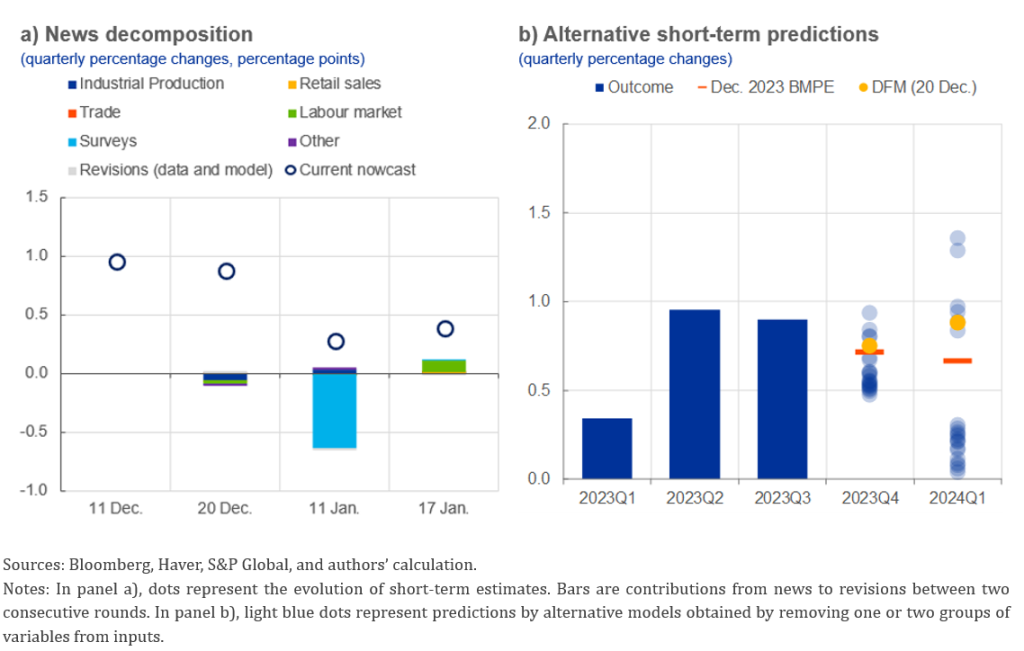
After having built a nowcasting model, the toolbox can be put to work for regular policy analysis of the economic conjuncture. The toolbox not only generates model predictions but also, for the purpose of facilitating policy analysis, offers insights on what’s happening “beneath the surface” of the model. Its outputs can be grouped in two broad categories serving different goals: 1) providing the narrative underlying model predictions, and 2) assessing the reliability of predictions.
The outputs aimed at providing the narrative underlying model predictions include:
On the other hand, the outputs aimed at gauging the reliability of model predictions include:
Figure 4. Examples of policy outputs
Besides opening the “black box”, another goal of offering many outputs is to maintain the policy relevance of the nowcasting toolbox, regardless of how reliable model predictions may be. Even a model that displays good nowcasting performances on average can be off at times due to the complexity of economic systems and unforeseeable events (Engle and Brown, 1986; Makridakis et al., 2009). In these un-avoidable cases when model predictions are off, some of the many outputs could still prove useful – notably the heatmap of input variables which provide a view of the raw input data (Figure 5).
Figure 5. Heatmap of input variables
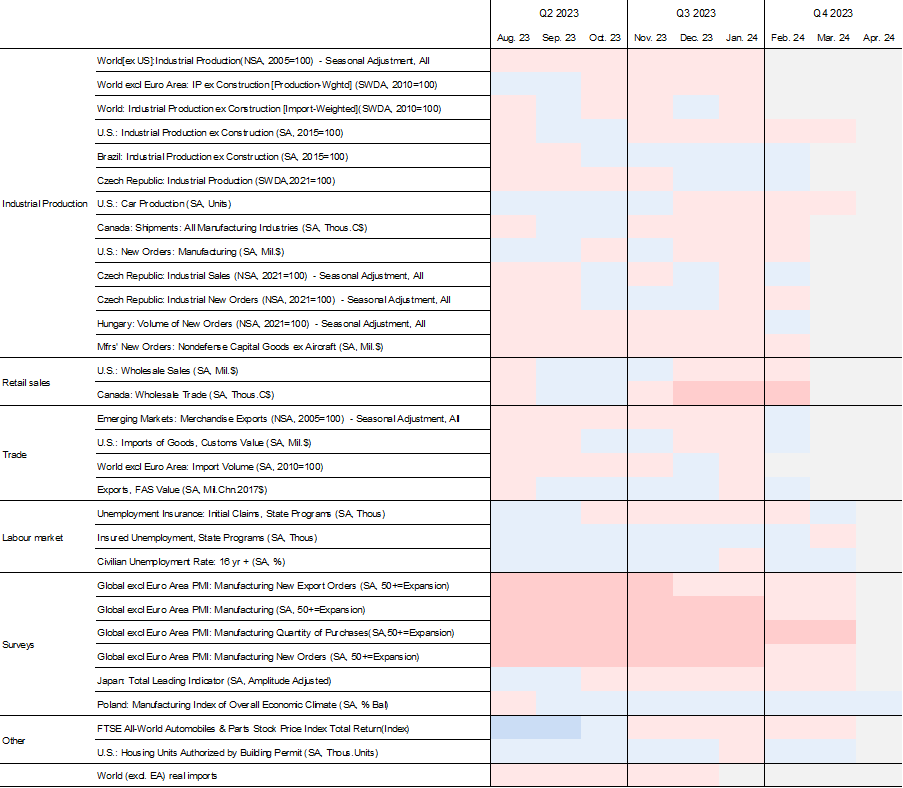
Sources: Bloomberg, Haver, S&P Global, and authors’ calculation.
Note: The heatmap is based on z-scores, computed by subtracting the mean and dividing by the standard deviation.
Our toolbox combines two main workstreams: First, building new models and evaluating existing ones on a periodical basis. Second, providing regular conjunctural policy analysis. In our example, we apply the toolbox to the revision of a model for quarterly global GDP growth, showcasing increases in model performance. The model outputs provided by our toolbox are designed to open the “black box” of nowcasting. As such, all toolbox features as well as the structured approach to building a model are designed to be valuable to users specialized and non-specialized in nowcasting applications. However, while we aim to provide a high level of automation and ease-of-use, careful user judgement is still required at every step when building, evaluating, and using models for policy analysis. The automated nature of the toolbox only aims to assist economists in arriving at an accurate, and most importantly, useful nowcasting model.
Bair, E., Hastie, T., Paul, D., and Tibshirani, R. (2006). “Prediction by supervised principal components”, Journal of the American Statistical Association, 101(473), 119–137.
Bańbura, M., and Modugno, M. (2014). “Maximum likelihood estimation of factor models on datasets with arbitrary pattern of missing data”, Journal of Applied Econometrics, 29(11), 133–160.
Bańbura, M., Belousova, I., Bodnár, K., and Tóth, M. B. (2023). “Nowcasting employment in the euro area”, Working Paper Series, No 2815, European Central Bank.
Cimadomo, J., Giannone, D., Lenza, M., Monti, F., and Sokol, A. (2022). “Nowcasting with large Bayesian vector autoregressions”, Journal of Econometrics, 231(2), 500–519.
Delle Chiaie, S., Ferrara, L., and Giannone, D. (2022). “Common factors of commodity prices”, Journal of Applied Econometrics, 37(3), 461–476.
ECB (2009). “New Procedure for constructing Eurosystem and ECB staff projection ranges” https://www.ecb.europa.eu/pub/pdf/other/newprocedureforprojections200912en.pdf
Efron, B., Hastie, T., Johnstone, I., and Tibshirani, R. (2004). “Least angle regression”, Annals of Statistics, 32(2), 407–499.
Engle, R. F., and Brown, S. J. (1986). “Model selection for forecasting”, Applied Mathematics and Computation, 20(3-4), 313–327.
Fan, J., and Lv, J. (2008). “Sure independence screening for ultrahigh dimensional feature space”, Journal of the Royal Statistical Society Series B, 70(5), 849–911.
Makridakis, S., Hogarth, R. M., and Gaba, A. (2009). “Forecasting and uncertainty in the economic and business world”, International Journal of Forecasting, 25(4), 794–812.
Reifschneider, D., and Tulip, P. (2019). “Gauging the uncertainty of the economic outlook using historical forecasting errors: The Federal Reserve’s approach”, International Journal of Forecasting, 35(4), 1564–1582.