The Covid-19 crisis has shown how high-frequency data can help tracking economic activity. Going forward, we investigate in a recent paper (available here) whether it can improve nowcasting performances for world GDP growth. To this end, we select a large dataset of 151 monthly and 39 weekly series. Nowcasting models that include weekly data significantly outperforms others, both in- and out-of-sample. More precisely, they strongly outperform others during “crisis” episodes (2008-2009, 2020) but have similar performances during “normal” times. We finally construct a nowcasting model for annual world GDP growth based on weekly data which give timely (once every week) and accurate forecasts (close to IMF/OECD projections but with 1-3 months lead). Policy-wise, this can provide an alternative “benchmark” projection during crisis episodes when usual “benchmark” projections (from IMF or OECD) are rapidly outdated.
The sudden shock of the Covid-19 crisis has put new emphasis on high-frequency data and a number of weekly, daily, or even hourly data have been extensively used to assess in real-time the impact of the Great Lockdown (e.g. Chetty et al. (2020) or Carvalho et al. (2020)). In the meantime, world GDP forecasts provided by international organizations such as the OECD and the IMF – which are widely used as “benchmark” projections by economists – have been outdated shortly after their releases given the large and sudden swings in global economic conditions, leaving most economists without such a “benchmark” during the crisis.
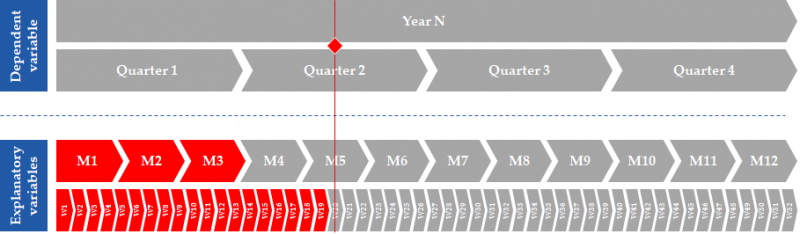
Against this background, our purpose is to assess whether high-frequency data can be used to nowcast world GDP growth on a timelier fashion, therefore providing an alternative “benchmark” projection. We exploit monthly and weekly indicators to nowcast quarterly and annual GDP growth. The comparative advantage of weekly data is represented in Figure 1: the red square figures a given date – around May 10th in this example – and available data at this date appear in red. Official quarterly growth rates for Q1 are not yet available (they are published on average 45 days after quarter end), monthly indicators are available only until month 3 (they are generally published around 20 days after month end) but weekly data are available up to the preceding week. Timeliness is the main reason why we consider incorporate such high-frequency data it in a nowcasting model.
Figure 1. Approach to nowcasting annual / quarterly world GDP growth
In addition, we face a lack of “world” variables – or their lack of timeliness when such series exist. We therefore rely on using comparable statistics for a number of countries. The idea is to build a large cross-national dataset from which we can extract the information into a few factors by a principal component analysis (PCA). Once extracted, this common trend can be taken as global variable. Following Bai and Ng (2008) – who showed that forecasting performances were improved when selecting fewer but more informative predictors – we select a dataset of 151 monthly variables and 39 weekly series out of 500 monthly and 250 weekly potential regressors. Our selection method is based on the correlation between these variables and our target variable (global GDP growth) in line with Bair et al. (2006)’s “supervised principal component”.
In the modelling phase, we rely on a Factor-Augmented MIxed DAta Sampling (FA-MIDAS) proposed by Marcellino and Schumacher (2008) which allow us to: (i) mix multiple frequencies as we forecast annual/quarterly GDP using monthly standard macroeconomic indicators (e.g. retail sales, PMIs) and weekly variables (e.g. US jobless claims, stock market indexes); and (ii) rely on a large dataset aggregating multiple cross-national variables. MIDAS regressions are then run using as explanatory variables the monthly and weekly factors extracted by PCA from our large dataset. Our approach is close to Ferrara and Marsilli (2019) which, to some extent, we extend to high-frequency data.
To test whether high-frequency data enhance nowcasting performances, we compare root mean squared errors (RMSE) across different models predicting quarterly world GDP growth. We mimic a “real-time” exercise by taking information available at the different months of the quarter. Major results can be found in Table 1. On the entire sample, high-frequency data improve nowcasting performance as the accuracy – both in-sample and out-of-sample – is significantly greater when a model includes weekly data. Importantly, this is equally the case when quarterly/monthly information is not available (i.e. on the 1st month of the quarter) as when such information is taken into account (i.e. on the last month of the quarter). These findings are robust to changes in MIDAS specification and in the dataset (e.g. leaving PMIs out, taking only advanced or emerging economies). These results are also confirmed more formally by Diebold and Mariano (1995) tests checking for significant difference in predictive accuracies.
In line with the intuition that high-frequency might be only of second-order when economic conditions are stable, we find that weekly data greatly enhances in- and out-of-sample performances during “crisis” episodes (2008-2009 and 2020) but have performances similar to other models during other “normal” periods. In other terms, during “crisis” episodes, weekly data has the advantage of providing a very timely signal that can make up for the long publication lags in monthly standard macroeconomic indicators. During “normal” periods however, the contribution of high-frequency data might only be of second-order. As high-frequency data are generally not statistically adjusted and can prove rather noisy, this might be conceptualized as a “signal-to-noise” ratio highly positive during “crisis” but not sufficient during “normal” times to outperform other models based on monthly standard macroeconomic indicators.
Table 1. Performances (RMSE) across models and months of the quarter
|
Model w/ weekly |
Model w/ weekly |
Model w/ only |
AR model |
||
| Entire sample | |||||
| In-sample | |||||
| 1st month |
0.442 |
0.476 |
0.530 |
0.689 |
|
| 2nd month |
0.211 |
0.270 |
0.466 |
0.692 |
|
| 3rd month |
0.202 |
0.230 |
0.285 |
0.692 |
|
| Out-of-sample | |||||
| 1st month |
0.599 |
0.557 |
0.562 |
0.868 |
|
| 2nd month |
0.422 |
0.455 |
0.516 |
0.589 |
|
| 3rd month |
0.351 |
0.430 |
0.447 |
0.589 |
|
| Crisis episodes | |||||
| In-sample | |||||
| 1st month |
1.057 |
1.161 |
1.364 |
1.635 |
|
| 2nd month |
0.264 |
0.387 |
1.139 |
1.433 |
|
| 3rd month |
0.271 |
0.362 |
0.584 |
1.433 |
|
| Out-of-sample | |||||
| 1st month |
1.540 |
1.439 |
1.456 |
1.709 |
|
| 2nd month |
1.007 |
1.140 |
1.324 |
1.545 |
|
| 3rd month |
0.803 |
1.064 |
1.130 |
1.545 |
|
| Non-crisis episodes | |||||
| In-sample | |||||
| 1st month |
0.236 |
0.239 |
0.206 |
0.300 |
|
| 2nd month |
0.202 |
0.248 |
0.232 |
0.203 |
|
| 3rd month |
0.189 |
0.203 |
0.206 |
0.203 |
|
| Out-of-sample | |||||
| 1st month |
0.235 |
0.212 |
0.208 |
0.318 |
|
| 2nd month |
0.227 |
0.206 |
0.203 |
0.197 |
|
| 3rd month |
0.211 |
0.205 |
0.192 |
0.197 |
|
Grey cells indicate best performance for a given mont
Coming back to our purpose of providing an alternative “benchmark” projection at higher frequency, we finally use our dataset to build a nowcasting model for the annual growth rate of world GDP. As shown in Figure 2, the “real-time” experience during the Covid-19 crisis shows that this model provides timely estimates for world GDP growth with a 1-3 months lead on IMF and OECD releases. For example, as soon as of mid-April 2020, our nowcasting indicates that the recession in 2020 would fluctuate around -4% before IMF’s and OECD’s projections eventually indicated the same estimates by mid-June.
Figure 2. Real-time nowcast and forecasts for the 2020 annual growth rate of world GDP
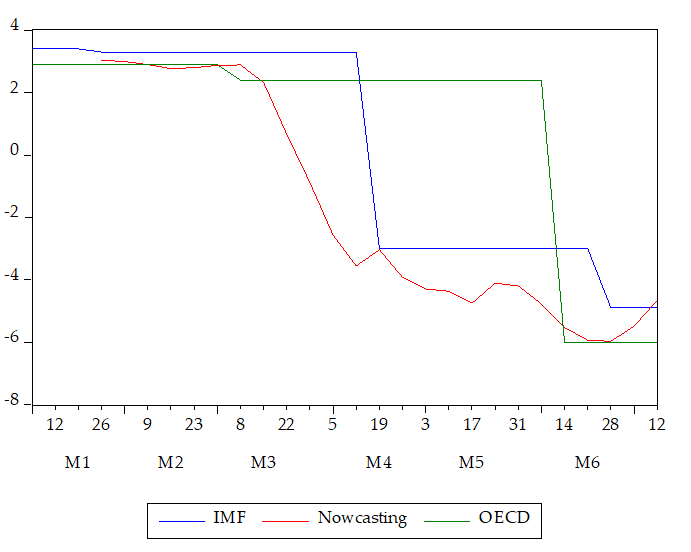
This nowcasting model might therefore serve as an alternative “benchmark” projection in particular during “crisis” episodes during which it has the double advantage of: (i) being needed since institutional projections (from IMF or OECD) become rapidly obsolete; and (ii) being more accurate compared to other models since our evidence suggests that models with high-frequency data strongly and significantly enhance the predictive accuracy during “crisis”. Policy-wise, this nowcasting model can be used by economists – as it is currently in the international macroeconomics division of the Banque de France – during those particular times to provide timely projections (once every week while institutional forecasts can be only updated three or four times per year) without sacrificing much on accuracy (forecasts appear to be close to IMF’s or OECD’s projections but with a 1-3 months lead).
Bai J. and Ng S. (2008). “Forecasting economic time series using targeted predictors”, Journal of Econometrics, 146(2), pp. 304-317.
Bair E., Hastie T., Paul D., and Tibshirani R. (2006). “Prediction by supervised principal components”, Journal of the American Statistical Association, 101(473), pp. 119-137.
Carvalho V., Garcia J., Hansen S., Ortiz Á., Rodrigo T., Rodrí guez Mora J., and Ruiz J. (2020). “Tracking the COVID-19 Crisis with High-Resolution Transaction Data”, Cambridge-INET Working Papers, No 2016.
Chetty R., Friedman J., Hendren N., Stepner M., and The Opportunity Insights Team (2020). “How Did COVID-19 and Stabilization Policies Affect Spending and Employment? A New Real-Time Economic Tracker Based on Private Sector Data”, NBER Working Paper, No 27431.
Diebold F. and Mariano R. (1995). “Comparing predictive accuracy”, Journal of Business and Economic Statistics, 13, pp. 253-263.
Ferrara L. and Marsilli C. (2019). “Nowcasting global economic growth: A factor‐augmented mixed‐frequency approach”, The World Economy, 42(3), pp. 846-875.
Marcellino M. and Schumacher C. (2008). “Factor-MIDAS for now- and forecasting with ragged-edge data: A model comparison for German GDP”, CEPR Discussion Papers, No 6708.