
This Policy Brief is based on Central Bank of Iceland Working Papers 2024/95. The views expressed are those of the author and do not necessarily reflect those of the Central Bank of Iceland.
Einarsson (2024) presents a method for real-time evaluation of the optimality of the current stance of monetary policy given the most up to date data available. Labelled as the real-time OPP, the framework combines estimates of the causal effects of monetary policy tools on inflation and the unemployment gap with forecasts for these target variables. The forecasts are generated with a nowcasting model, incorporating new data as it becomes available, while using entropy tilting to anchor the long end of the forecast at long run survey expectations. In a retrospective analysis of the Fed’s monetary policy decisions in the lead up to the Great Recession we find that we can reject the optimality of the policy stance as early as the beginning of February 2008. This early detection stems from the timely nowcasting of the deteriorating unemployment outlook.
How do we know whether the stance of monetary policy is optimal at any given point in time? Giving a timely answer to this question is of vital importance for policy makers as well as other agents in the economy. At the same time economic data relevant to the policy decisions is released every week. In view of this, Einarsson (2024) proposes a framework for the online monitoring of the stance of policy that incorporates the information given by the constant inflow of new data. This framework allows us to continuously update our assessment of the adequacy of the current stance of monetary policy.
We refer to this framework as the real-time OPP as it takes the general form of the OPP statistic of Barnichon & Mesters (2024) which has the clear benefit that we do not need to know the true underlying structure of the economy. The statistic depends on the causal effects of policy instruments on the target variables along with conditional expectations of the target variables given a choice for the policy instruments. The real-time aspect comes from the fact that at the end of each week, we update the conditional expectations of the paths of the target variables given all data available up to and including that week. This will give us a timely indicator of whether the current stance of policy is optimal or not.
The fact that we test optimality of the stance of policy at the end of each week rather than testing the optimality of specific policy decisions, which happen at a frequency much lower than weekly, warrants some discussion. While the policy maker could, in theory, decide on policy each week, there are significant prohibitive costs to doing so. The real-time OPP should therefore be viewed as a thought experiment that supposes that the policy maker could adjust its policy at no cost in each week as a reaction to newly released information. In that setting, the real-time OPP gives the answer to the question if and how the policy maker should adjust its policy stance in light of new data. An alternative interpretation is that the sequence of test statistics between two consecutive policy decisions informs us how we should expect the policy maker to adjust their policy stance at the upcoming decision if they were to set policy optimally.
Furthermore, the test statistic has an interpretation as the adjustment to the policy instrument that would correct an optimization failure and thus, that only if the test statistic has a value of zero can we not reject a hypothesis that the stance of policy is, in fact, optimal. Additionally, the uncertainty inherent in the estimates of both the causal effects and the conditional expectations will serve to facilitate the use of the test statistic in a manner similar to a hypothesis test. The combined uncertainty allows us to calculate confidence bounds around the test statistic and thus allow us to make statements about a particular policy stance not being optimal at some confidence level.
In order to implement the framework, we need estimates of the causal effects of the policy tools, the Fed Funds rate and the slope of the yield curve, on the target variables, inflation and unemployment, and the conditional expectations for the paths of inflation and unemployment that incorporate the real-time inflow of data. While leaving the technical details to the paper, a few words on how the conditional expectations are formed are warranted. Given the mixed frequency nature of the inflow of data that is to be incorporated into the evaluation, a nowcasting approach lends itself naturally to generating forecasts of the variables of interest. However, as the horizon over which monetary policy decisions are made extends well beyond what is usually considered in the nowcasting literature, we will augment the long end of the forecasts with long-run forecasts from the Survey of Professional Forecasters using relative entropy.
We find that the use of higher frequency information improves the nowcasting accuracy over a standard quarterly BVAR model and that including the external information contained in the SPF survey on long-run expectations improves the forecasting performance over the horizon relevant to monetary policy decisions. While we see improvements for both the inflation and unemployment rates, the results are stronger for the unemployment rate. In particular, the results of a comparison of nowcasting performance across the weeks of a quarter are presented in Table 1 in Einarsson (2024). In the case of inflation, the RMSE is lower for the nowcasting model (labeled as CR-BVAR) across all weeks of the quarter, except for week 5, where the models perform roughly equally well, indicating that the inclusion of higher frequency information leads to improvements in nowcasting ability. A one-sided Diebold and Mariano (1995) (DM) test of whether the nowcasting model CR-BVAR outperforms a quarterly BVAR on the same dataset at a quarterly frequency further supports this result. For the first two weeks of a quarter and from the ninth week onwards we can reject the null hypothesis of equal nowcasting ability at the 10% (and lower) level. Comparing these results to the RMSE of the Greenbook nowcast and the SPF nowcast we see that, while the CR-BVAR model performs similarly to the SPF for the first four weeks of a quarter, the RMSEs diverge from the fifth week onwards with the CR-BVAR outperforming the SPF. At the same time, while the Greenbook nowcast outperforms the CR-BVAR nowcast for the first four weeks, the CR-BVAR model closes most of the gap during the fifth week.
For unemployment the results are starker. Across all weeks of a quarter, the RMSE for the CR-BVAR model is consistently lower than for the QBVAR model. Performing a one-sided Diebold-Mariano test allows us to reject the null that the models perform equally well at the 1% level across all the weeks of a quarter against the alternative of the CR-BVAR outperforming the QBVAR. Again, this indicates that incorporating higher frequency information improves nowcasting ability. Comparing the CR-BVAR nowcasts to that of the Greenbook and SPF, we see that the CR-BVAR nowcast outperforms both across all the weeks of a quarter although the Greenbook does catch up to the CR-BVAR nowcast in the last two weeks of a quarter.
Figure 1 presents the results for the real-time OPP statistic, calculated at the end of each week from the start of 2005 until the end of 2019, for a total of 720 real-time weekly vintages of data, along with 50% confidence bounds for both the Fed Funds rate and the slope policy. Starting with the top panel, which presents the results for Fed Funds rate, we see that we cannot reject that the level of the Fed Funds rate was optimally set from the beginning of 2005 to mid-2007. However, from that point onwards, the real-time OPP grows increasingly negative until the Fed Funds rate reaches the zero lower bound (ZLB) at the end of 2008. We can reject that the Fed Funds rate was optimally set as early as the beginning of February 2008, the same week the Fed lowered its interest rate by 0.5 percentage points. Furthermore, except for the weeks of February 29, March 14, May 18, and August 1, we can reject optimality in every week leading up to the Fed hitting the. This indicates that according to the real-time OPP the Fed should have lowered its interest rate both sooner and more aggressively than it did. When the Fed began raising its interest rate at the end of 2015 the real-time OPP is negative and remains so until around the first half of 2017. However, we cannot reject that the Fed Funds rate was optimally set in the period after the zero lower bound.
Figure 1
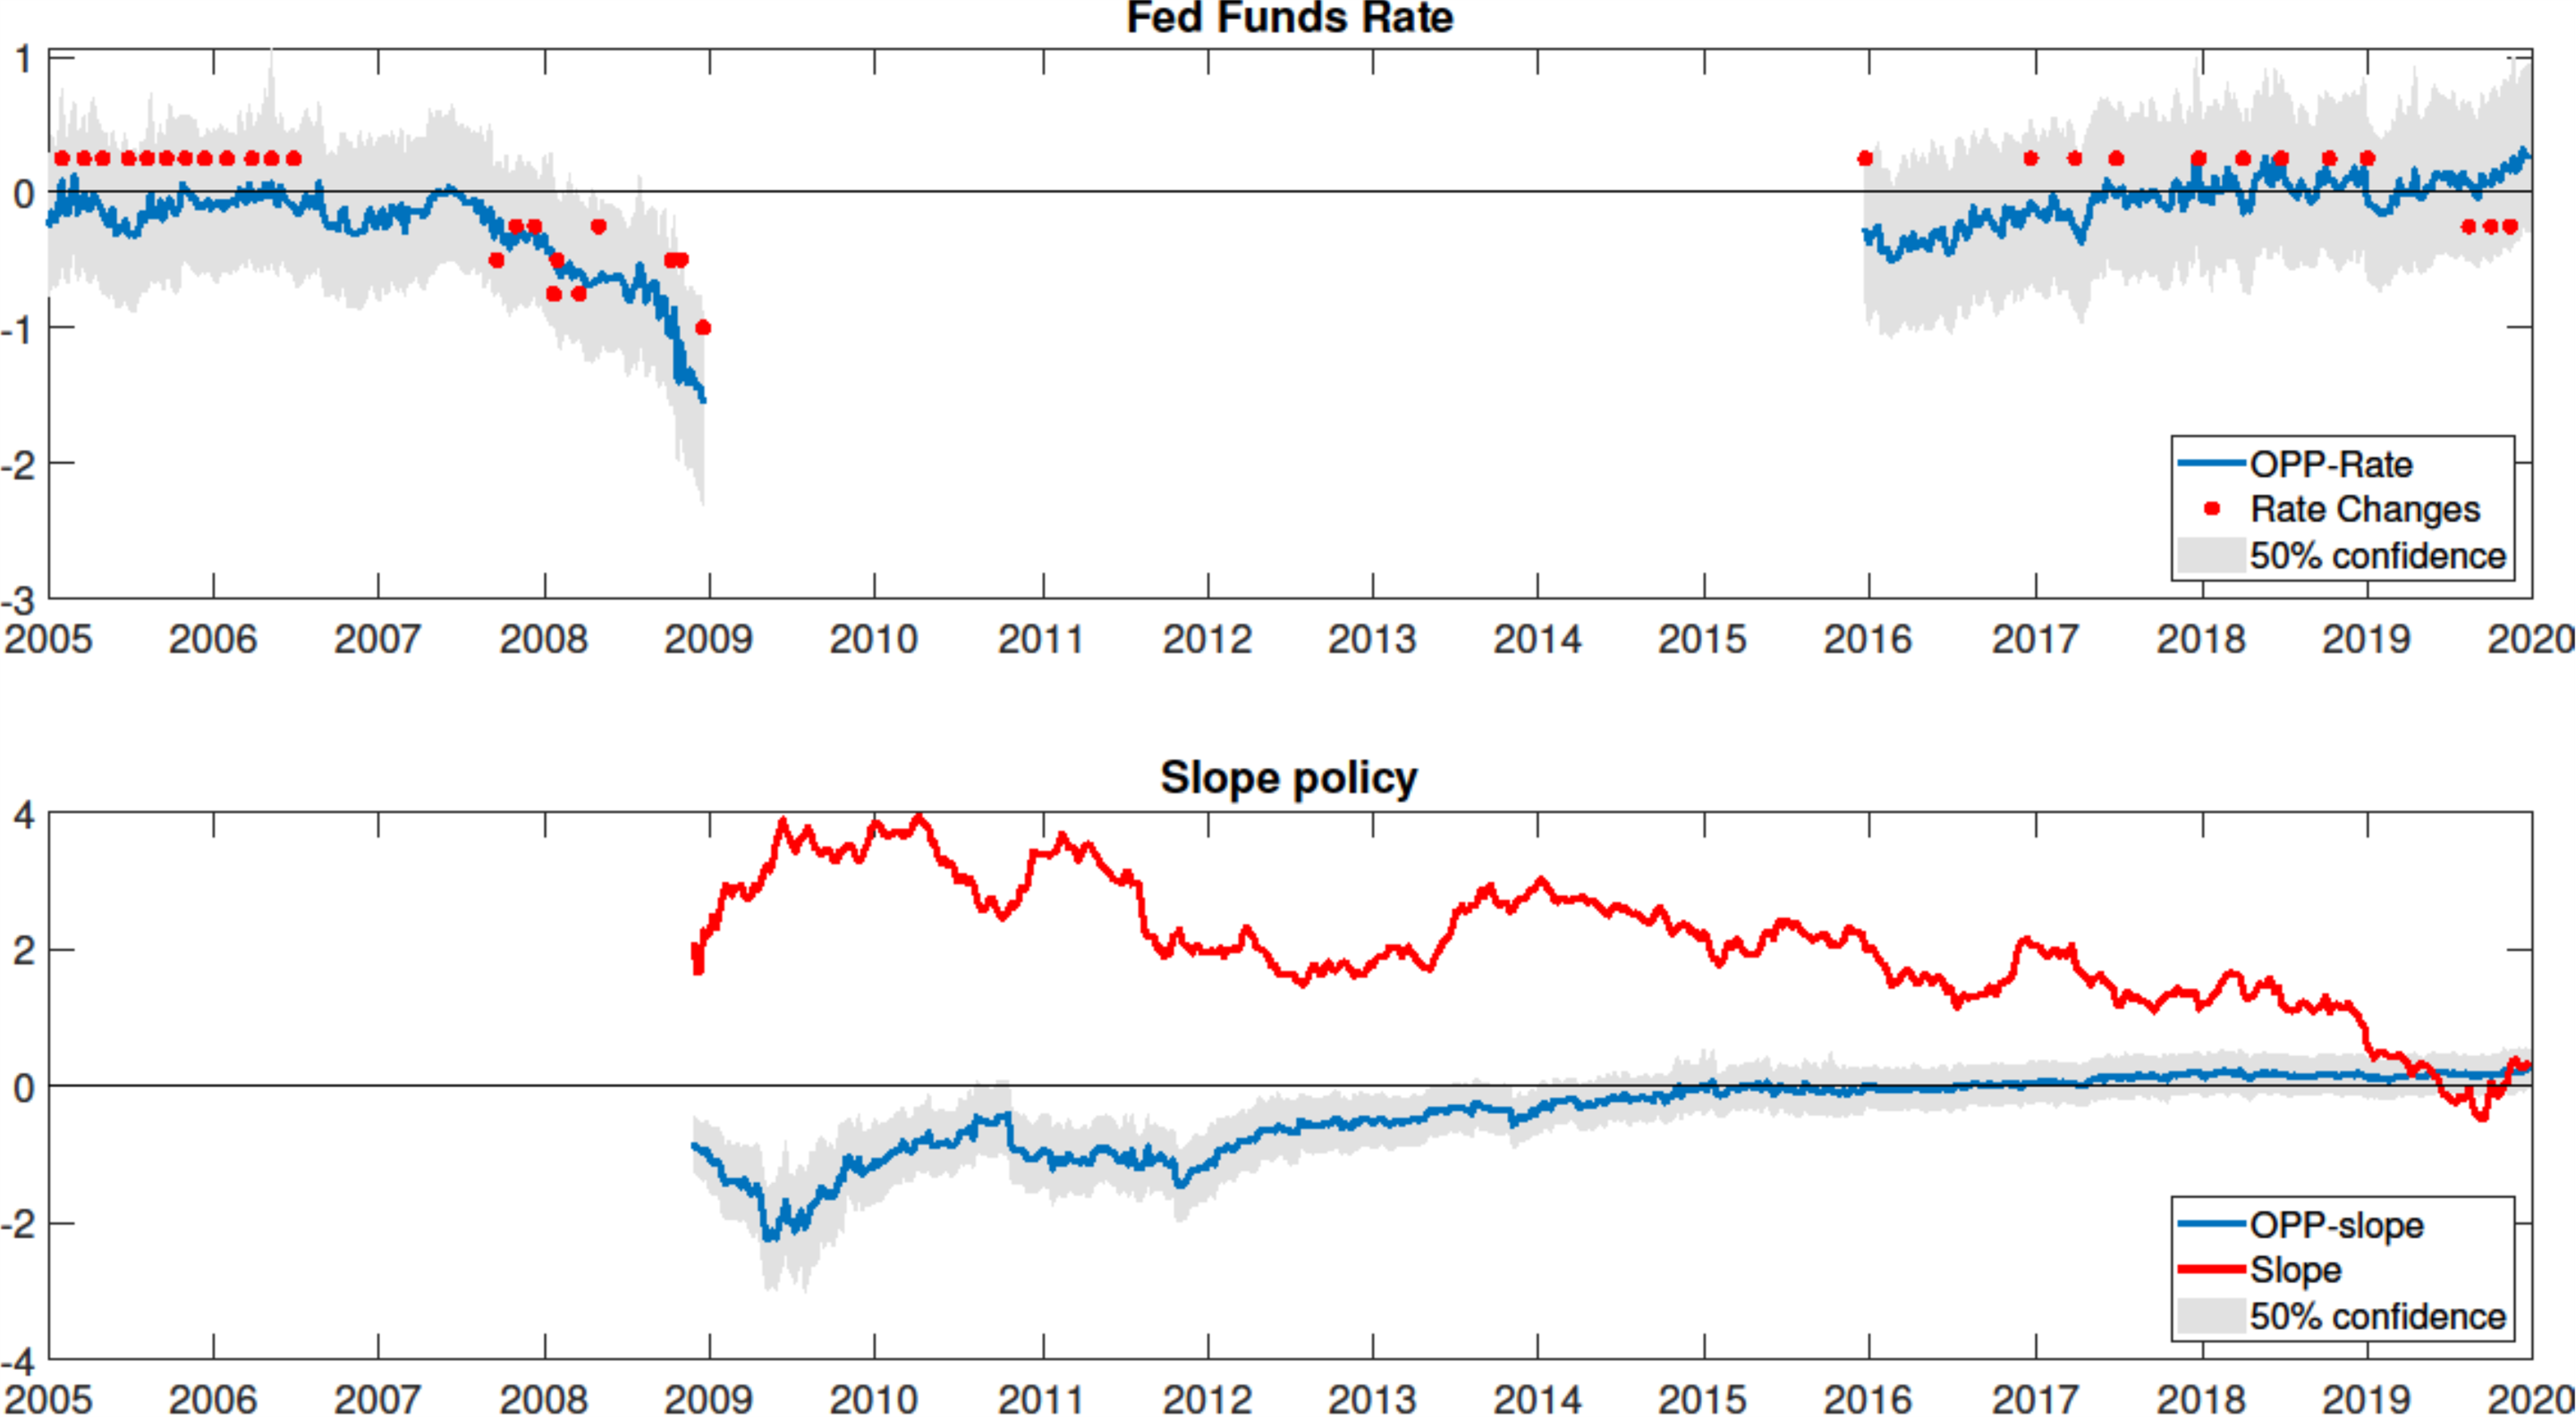 Notes: Top panel: Real-time OPP statistic (in percentage points) for the Fed Funds rate and realized changes to the Fed Funds target rate. Bottom panel: Real-time OPP statistic (in percentage points) for the slope policy and the slope of the yield curve defined as the difference between the 10-year bond yield and the Fed Funds rate. Shaded areas represent impulse response and model uncertainty at 50 percent confidence.
The bottom panel of Figure 1 presents the results for the slope policy. We see that around the time the Fed Funds rate is reaching the zero lower bound at the end of 2008 we can reject the hypothesis that the slope policy was set optimally. According to the real-time OPP, the Fed should have employed its slope policy to bring the slope almost a percentage point lower than it actually was at the onset of the ZLB. As the long-term interest rate started rising through to mid-2009, while the Funds rate was stuck at the ZLB, the real-time OPP indicates that the Fed should have conducted its policy such that the long-term interest rate, and thus the slope, should have been up to 2 percentage points lower than it actually was. In fact, we can reject slope policy being optimally set until the end of May 2013, with the exception of mid-August and October 2010. Additionally, we can reject the slope policy being optimally set in November and December of 2013. From then on, we cannot reject the slope policy being optimally set.
In the paper, we dive deeper into the lead up to the Fed Funds rate hitting the zero lower bound and the causes of both the changes in the nowcasts and the real-time OPP statistic. While leaving the details for the paper, the early detection of optimization failures stems from the superior nowcasting performance of the framework developed and, in particular, the ability to accurately nowcast the deteriorating unemployment outlook. In fact, when comparing the nowcasts to the Fed’s Greenbook forecasts we see that the nowcasting framework is consistently anticipating the revisions to the Greenbook unemployment outlook. In summation, the real-time OPP suggests that the failures in the setting of the stance of monetary policy in the lead up to the Great Recession were first and foremost due to not fully taking into account changes in in the outlook of the unemployment rate.
Barnichon, Regis, and Geert Mesters. 2023. “A Sufficient Statistics Approach for Macro Policy” American Economic Review, 113(11): 2809-45.
Einarsson, Bjarni G. 2024. “Online Monitoring of Policy Optimality” Central Bank of Iceland Working Paper 2024/95.
