The investment policy of an occupational pension fund is typically expressed by its asset allocation, or the portfolio diversification across various asset classes such as stocks and bonds. Most pension funds disclose information about their asset allocation in their annual reports and on their website. By contrast, much less is known about the choices that pension funds make within their stock and bond portfolios. We study these choices for pension funds in the Netherlands. Ideally information on the holdings in individual stocks and bonds makes it possible to analyse these portfolio choices. Because this information is not readily available for all pension funds, we follow an alternative approach. Our research design is based on analysing the returns that pension funds in the Netherlands report on their stock and bond portfolios. We determine to what extent these portfolio returns are driven by a number of return factors, in particular the market return and the returns on four style factors namely value, momentum, carry and low beta. In doing so we find substantial heterogeneity in these factor exposures showing that pension funds make distinct choices within their stock and bond portfolios. The heterogeneity is sizable and equivalent to a return difference of 1.31-2.35 percentage points on an annual basis. This raises the question of what drives these differences. We find that the funding ratio, risk aversion, and liability duration explain 36 percent of this heterogeneity. We attribute the remaining 64 percent to differences in investment beliefs. Beliefs therefore have important economic implications for the beneficiaries of a pension fund.
Occupational pension funds play a pivotal role in society as many people depend on them for their retirement savings and investments. Occupational pension funds typically are the second in a three-pillar structure. The first pillar consists of state-sponsored old-age income insurance available to all citizens, while the third pillar are voluntary individual retirement savings. Second pillar pensions are job-related and often (quasi) mandatory. According to the OECD, occupational pension funds around the globe manage USD 32 trillion, which is equivalent to 37 percent of the world’s GDP (https://stats.oecd.org/). The investments of these pension funds serve a similar objective namely, to finance the current and future liabilities towards their beneficiaries. Understanding what drives pension funds to structure their investments in a particular way is important because even small differences in investment strategies may lead to large divergences in performance across pension funds over time. Consequently, these divergences may have a substantial impact on the beneficiaries’ purchasing power after retirement or the contributions being made during the accrual phase.
Despite their crucial role in society, so far only a few studies analyse the investment strategies of pension funds. The lack of access to comprehensive and detailed data on pension funds’ investments is the main reason for the limited number of studies. Furthermore, the focus in the papers available is on the asset allocation. Rauh (2009) and Andonov, Bauer and Cremers (2017), for instance, study the effects of regulatory incentives on risky asset allocations for US corporate and public pension plans respectively. In a recent paper Broeders and de Haan (2020) decompose investment returns of Dutch pension funds into four key investment decisions: asset allocation, market timing, security selection, and benchmark selection. A benchmark is used for return evaluation and reflects the investment universe that is specific to a pension fund. The authors show that benchmark selection for equity, bond, and real estate portfolios on average explains 33 percent of cross-sectional returns whereas asset allocation explains only 19 percent of the variation in pension fund returns. This already indicates that pension funds make distinct investment choices within their portfolios based on risk and style preferences.
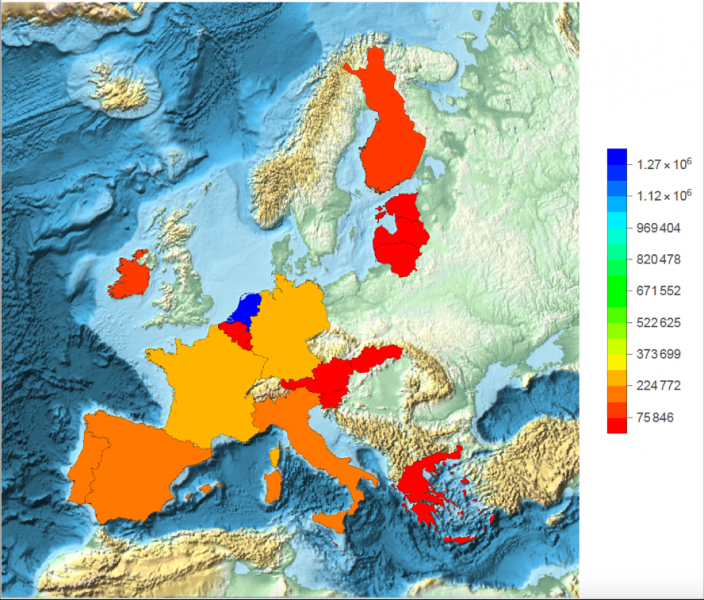
We also study the investment decisions of occupational pension funds in the Netherlands. The Dutch occupational pension system is economically important because it is large in terms of total assets under management (AUM). In 2018, the AUM equalled approximately 1.4 trillion euros reflecting 175 percent of GDP in the Netherlands. Furthermore, the Dutch occupational pension system represented 53 percent of the total assets of pension funds in the euro area, see Figure 1.
Figure 1. Total assets in million EUR in funded and private pension plans in the euro area (OECD 2019).
Most of the pension funds in the Netherlands execute a so-called collective defined-contribution scheme. In such a pension scheme, beneficiaries accrue benefits, similar to in a defined-benefit scheme. These benefits are determined independent of the pension fund’s investment returns by a formula that accounts for an employee’s salary and years of service. However, the scheme also contains features of a defined-contribution scheme because the annual cost-of-living adjustment of the accrued benefits is contingent on the pension fund’s funding ratio, or the ratio of assets over liabilities. This adjustment is typically referred to as indexation. This contingent feature works as follows (see Broeders, 2010). If the funding ratio for instance exceeds 130 percent, then full indexation will be granted in line with the actual rate of inflation. If the funding ratio is below 130 but above 105 percent, partial indexation can be granted. A funding ratio below 105 percent means no indexation, and if the funding ratio is structurally below the minimum funding requirement of 105 percent even a reduction in accrued benefits may be required by law. This policy ladder shows that in a collective defined-contribution scheme, the ultimate benefits not only depend on salary and years of service but also on investment returns via a pension fund’s funding ratio. Over the full duration of the pension scheme the impact of returns, via indexation, on benefits can be huge.
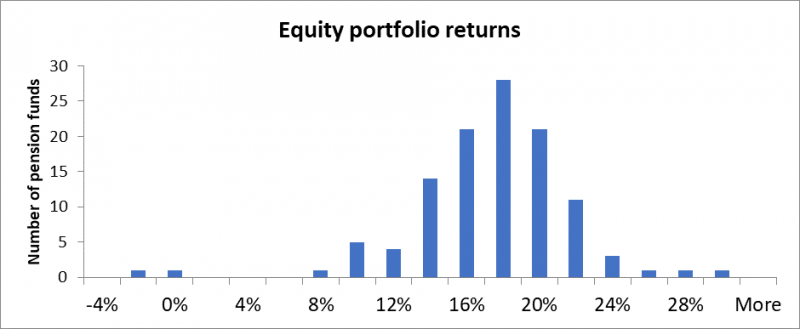
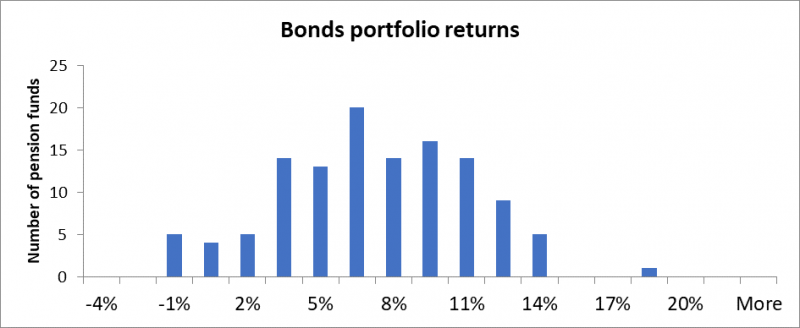
We use proprietary quarterly return data from 572 Dutch occupational pension funds from 1999Q1 through 2017Q4 that these pension funds report for regulatory purposes to De Nederlandsche Bank. Since 2010, all pension funds compute time-weighted investment returns in accordance with the Global Investment Performance Standards (GIPS). Pension funds report the overall portfolio return and the equity and the bond portfolio return separately. Because the reporting requirements are mandatory, the data are free of self-reporting biases. As an example, Figure 2 shows the frequency distribution of the annualised equity and bond portfolio returns for the last quarter of 2017. Both distributions reveal a wide dispersion of portfolio returns across the pension funds in our sample. This indicates that pension funds make distinct choices within stock and bond portfolios.
Figure 2. Realized annualised equity and bond returns in 2017Q4 for all pension funds that report to De Nederlandsche Bank.
The primary objective of our study is to measure this heterogeneity in investment strategies within stock and bond portfolios across pension funds, to identify the drivers of this heterogeneity, and to show the effects it has on the expected retirement incomes or pension contributions. To analyse these differences, we start with a model that solves a mean-variance optimization problem of assets minus liabilities in the spirit of Sharpe and Tint (1990). The solution to this problem shows that the optimal portfolio consists of two distinct parts: a hedging portfolio and a speculative portfolio. On the one hand, the pension fund invests in bonds to “match” the future stream of cash flows being paid to beneficiaries. On the other hand, the pension fund invests in risky assets that offer a risk premium. The higher expected return on these assets serves to finance indexation. For the full model and its technical details, we refer to Broeders and Jansen (2021).
In our model, the hedging portfolio is determined by the pension funds funding ratio and the duration of the liabilities relative to the duration of the bond market. The speculative portfolio is driven by the expected risk and return of stocks and bonds and the pension fund’s risk aversion. We cannot directly observe this risk aversion parameter, but we conjecture that it is inversely related to the risk-based “required funding ratio” that is imposed by regulation on pension funds in the Netherlands. The method to determine the pension fund specific level of this ratio is prescribed by law and is comparable to the solvency requirements for banks and insurance companies. If a pension fund takes a large mismatch between assets and liabilities it will have a high required funding ratio. This high required funding ratio therefore shows a pension fund’s willingness to accept more risk.
Rather than examining the hedging and speculative portfolios directly, we study investment strategies through factor exposures. In particular, we determine to what extent the returns on stock and bond portfolios are driven by return factors. The rise of the global factor literature enables a granular study of investment strategies within asset classes. This literature shows that next to market factors, style factors that are based on a particular signal perform robustly across countries and asset classes. We include the following style factors in our analysis: momentum and value both from Asness, Moskowitz and Pedersen (2013), low beta from Frazzini and Pedersen (2014), and carry from Koijen, Moskowitz, Pedersen and Vrugt (2018). These factors are constructed by creating long-short positions in assets with opposing characteristics. The returns on these long-short portfolios are the factor returns that we will use in our analysis. For equities we use the returns on the MSCI World Index and the Euro Stoxx 50 to represent the market return and we use the global style factors from AQR and Ralph Koijen’s website. For bonds we use the return on the Bloomberg Barclays Euro Aggregate Bond Index to represent the investment grade bond market and the Bloomberg Barclays Euro High Yield Index to represent the credit market. For bonds, we construct European style factors ourselves as the pension funds in our sample primarily invest in euro-dominated bonds.
We analyze the heterogeneity in investment strategies of Dutch pension funds in four steps. The first step is to measure factor exposures and to estimate the cross-sectional heterogeneity in factor exposures for both equity and bond portfolios. The second step is to link factor exposures to objective pension fund characteristics in our model, in particular the funding ratio, liability duration and risk aversion. The third step is to measure the differences in the subjective implied beliefs on the factor returns. The fourth and final step is to analyse the impact of regulations on investment strategies. Along these lines we report the following results.
First, we find surprisingly large heterogeneity in both equity and bond factor exposures across pension funds. This heterogeneity translates into important differences in average returns across pension funds. For equities, the heterogeneity is primarily driven by differences in the exposures to the style factors. For instance, the carry factor contributes negatively to average annual returns by 1.25 percentage points for pension funds with the lowest exposure to carry, whereas this factor contributes positively to average returns by 0.44 percentage points for pension funds with the highest exposure to carry. For low beta, the return contribution ranges from -0.05 to 1.66 percentage points. For bonds, the heterogeneity in average returns is primarily driven by the exposure to the market factor and ranges from 1.99 to 3.82 percentage points.
Panel A of Table 1 provides a summary of the results at the total portfolio level, that is, the equity and bond portfolios combined. On a total portfolio level, pension funds with the highest factor exposures versus pension funds with the lowest factor exposures have a 2.35 percentage points higher average return on the total portfolio. Of this difference, 1.31 percentage points is driven by difference in exposure to the market factor and 1.04 percentage points by differences across pension funds to style factors.
Table 1: This table shows the average returns of pension funds in excess of the risk-free rate in percentage points, divided into five groups. Group 1 reflects the pension funds with the lowest average returns that result from the factor exposures, whereas group 5 shows the pension funds with the highest ones. We show the results for the total returns unadjusted for pension fund characteristics (Panel A) and adjusted for these characteristics (Panel B).
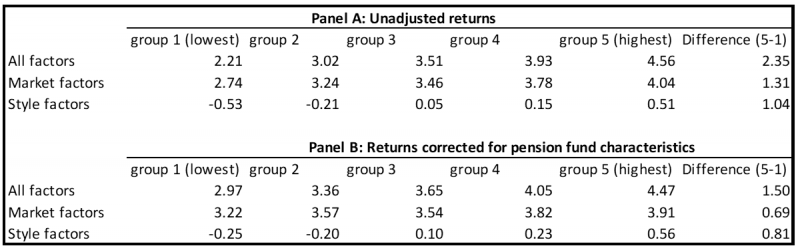
Second, we show that the objective pension fund’s characteristics drive the heterogeneity in the factor exposures. Consistent with the predictions of our model, we find for instance that pension funds with a low funding ratio, high risk aversion, and long liability duration have higher exposures to the investment-grade bond market factor but lower exposures to the other factors. In Panel B of Table 1 we correct the pension fund returns for the differences in characteristics. This correction means that we adjust the pension fund’s return with the fraction of the return that is explained by a difference in characteristics. For instance, if a pension fund obtains a higher return on the bond portfolio because it has a higher liability duration compared to the average pension fund, we lower the pension fund’s bond return accordingly. This results in a lower heterogeneity of average returns. For instance, if we compare Panel B with Panel A in Table 1, we find that the heterogeneity in return contribution of the market between the highest and lowest group decreases from 1.31 to 0.69 percentage points. This decrease means that roughly 50 percent of the heterogeneity in the return contribution of the market is explained by pension fund characteristics. Taking the market and style factors together, the pension funds’ characteristics explain 36 percent of the heterogeneity in average returns.
Third, we show that the remaining differences in investment strategies can be attributed to differences in the implied beliefs on the expected returns. We infer these subjective implied beliefs by using our theoretical framework, that is, we derive the returns pension funds demand in order to explain the level of their factor exposures. We then show that the pension funds disclose these differences in beliefs through their choices of asset management firms, at least to a reasonable degree. If a pension fund hires a new asset management firm to manage the equity or bond portfolio, we find that these have a statistically and economically sizeable effect on the factor exposures.
Fourth, we show that regulations and in particular the liability discount rate, affect investment strategies. In 2007 a fixed liability discount rate of 4 percent was replaced by the term structure of risk-free market interest rates to determine the present discounted value of accrued benefit obligations. This change in methodology has led pension funds to increase their exposure to the investment-grade bond market and to the low beta factors, while lowering their exposure to the value and carry factors for bonds.
We find substantial heterogeneity in the investment strategies of Dutch pension funds that reflect a return difference of 1.31-2.35 percentage points on an annual basis. We show that funding ratio, risk aversion, and liability duration affect the investment decisions of pension funds within their stock and bond portfolios. However, we find that these objective characteristics only explain 36 percent of the heterogeneity in the average returns across pension funds. The remaining heterogeneity reflects an economically sizeable difference in the average annual returns of 0.70-1.50 percentage points. This is equivalent to a difference in expected retirement income of 16-32 percent over a 40-year accrual phase or to an increase in contributions of 19-46 percent to accrue the same retirement income.
Our results have important policy implications. Our approach makes a distinction between a hedging demand and a speculative demand for assets, that we measure through factor exposures. While the liabilities of a defined-benefit or a collective defined-contribution pension fund can be measured objectively, a crucial part of the investment strategy is to form beliefs that drive the speculative demand. These beliefs require careful consideration and decision-making by a pension fund’s board of trustees. Further, pension funds should explain and disclose their investment strategy and beliefs in a clear and transparent way to their beneficiaries. This is particularly important because beneficiaries are typically not free to choose their own pension fund as it comes with the job. The exit costs to leave a pension fund if a beneficiary is dissatisfied with the investment strategy are prohibitively high. Employees would need to change jobs to change pension funds and retirees cannot change them whatsoever. Therefore, an import fiduciary duty rests on each pension fund to invest in the best interest of their beneficiaries.
Andonov, A., R. Bauer and M. Cremers (2017), Pension fund asset allocation and liability discount rates, The Review of Financial Studies, 30(8), 2555-2595.
Asness, C.S., T.J. Moskowitz and L.H. Pedersen (2013), Value and momentum everywhere, The Journal of Finance, 68(3), 929-985.
Broeders, D. (2010), Valuation of contingent pension liabilities and guarantees under sponsor default risk, Journal of Risk and Insurance, 77(4), 911-934.
Broeders, D. and L. de Haan (2020), Benchmark selection and performance, Journal of Pension Economics and Finance, 19(4), 511 – 531.
Broeders, D. and K. Jansen (2021), Pension funds and drivers of heterogeneous investment strategies, working paper available on SSRN: https://papers.ssrn.com/sol3/papers.cfm?abstract_id=3446239
Frazzini, A. and L.H. Pedersen (2014), Betting against beta, Journal of Financial Economics, 111(1), 1-25.
Koijen, R.S., T.J. Moskowitz, L.H. Pedersen and E.B. Vrugt (2018), Carry, Journal of Financial Economics, 127(2), 197-225.
Rauh, J. (2009), Risk shifting versus risk management: Investment policy in corporate pension plans, The Review of Financial Studies, 22(7), 2687-2733.
Sharpe, W.F. and L.G. Tint (1990), Liabilities: A new approach, The Journal of Portfolio Management, 16(2), 5-10.