menu
close

Author(s):

Andrea Papetti | Bank of Italy

Keywords:

Population aging , relative prices , capital flows , overlapping generations , tradable nontradable , secular stagnation , structural transformation , global imbalances

JEL Codes:

Population aging can help explaining three key macroeconomic global trends and their likely persistence in the future. First, the decline of real interest rates (secular stagnation). Second, the growing imbalances in net foreign asset positions across countries (global imbalances). Third, the sectoral reallocation of resources from the goods (tradable) sector towards the services (non-tradable) sector (structural transformation).

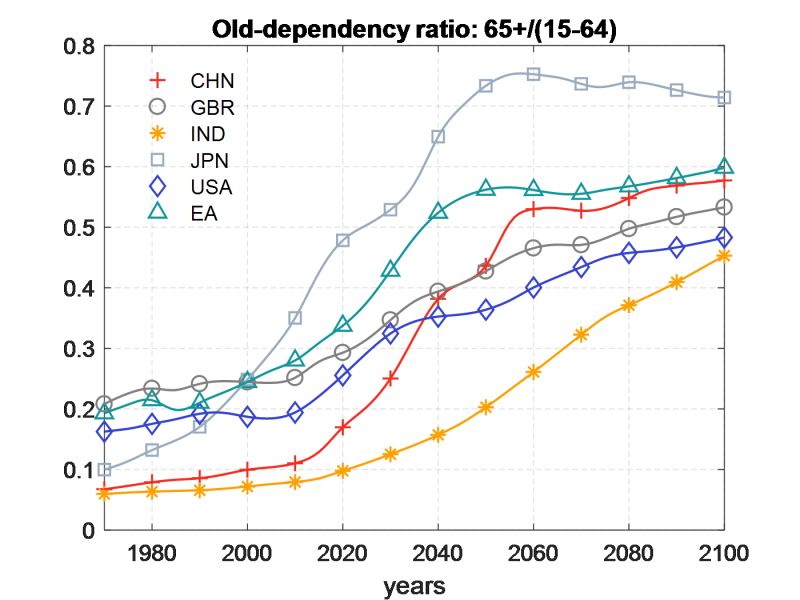
Most countries of the world are aging, namely their relative number of old individuals (usually classified as those aged more than 65) is growing (Figure 1) – albeit at different intensity – driven by falling fertility and mortality rates. Importantly, demographic variables tend to evolve with well definite time lags thus providing a quite unusual degree of knowledge about the future as compared to other branches of social sciences. However, to the definiteness of demographic projections there does not correspond unanimity on the implied macroeconomic consequences. Most tend to predict a secular stagnation with low real rates of return but for offsetting public policies (e.g. Rachel and Summers, 2019) and rising global imbalances due to a mounting savings glut (Auclert et al., 2021). On the contrary, an influential hypothesis posits that global population aging might lead to a reversal of some key macroeconomic trends including a decline of China’s current account surplus and a rise in inflation and real rates (Goodhart and Pradhan, 2020).


Figure 1:
Old-dependency ratio, number of elderly relative to working-age individuals

 width=
Source: United Nations (2019) medium-variant projections.

Model

To contribute to this debate, in a recent working paper (Papetti, 2021b) I have employed a large scale overlapping generation model suitable for quantifying the macroeconomic effects of demographic changes for an integrated global economy composed by 18 countries (covering about 70% of world GDP) and two sectors (tradable vs non-tradable). In the context of a typically neoclassical environment on the production side, the model captures the main heterogeneity along the age dimension of households who optimally choose savings to smooth consumption over the life cycle discounting the (time- and age-varying) mortality risk and devote a higher fraction of their consumption basket towards non-tradable items while growing older. The model encompasses a complex interconnection of differences across countries that include relative productivity levels, discount factors, generosity of the pension systems as well as the parameters governing the sectoral allocation, such as capital intensity and labor and consumption substitutability. Assumptions hold that capital (labor) is perfectly mobile (immobile) across countries while migration flows can exogenously occur in each period. Data and (medium-variant) projections from the United Nations provide the demographic statistics at the annual frequency that feed the model exogenously – as it is standard in the literature – and represent the only shock in the economy in order to isolate the causal impact of demographic change.

Main results

The results from the dynamic simulations of the model suggest that population aging can explain significant portions of three key macroeconomic trends that have characterized the global economic development since the 1980s.

1. Secular stagnation

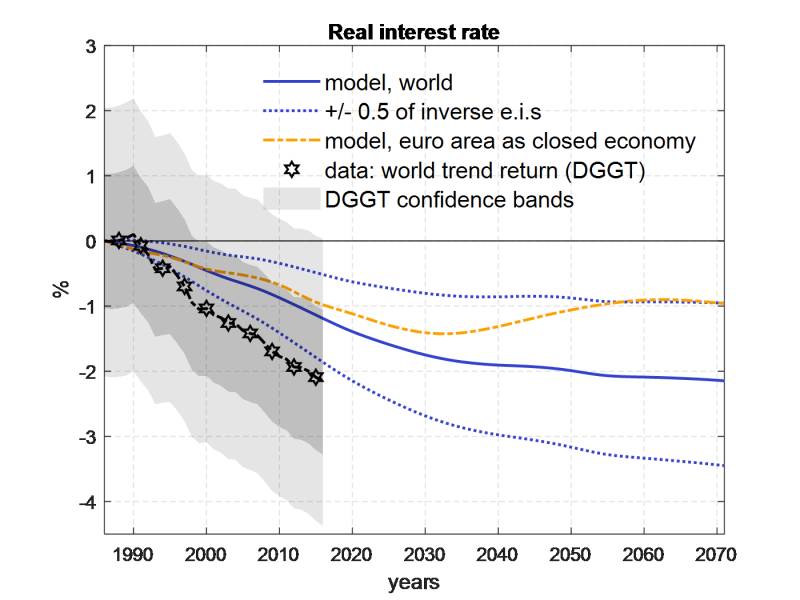
In line with the academic literature employing large scale overlapping generation models, I find that population aging exerts a significant downward pressure on real interest rates (Figure 2).

The world real interest rate is the equilibrium return that allows the savings demand by firms to meet the savings supply by households. Population aging brings about two main changes. On the one hand, households are willing to save more in response of higher survival probabilities to finance consumption over a longer period of life. On the other hand, firms react to the growing scarcity of effective labor force by demanding less savings to invest in capital that complements labor in production. Clearing in the world capital market dictates an equilibrium where the overabundance of savings stemming from higher supply and lower demand is absorbed via a lower real interest rate.

To the most recent literature employing large scale overlapping generation models,1 I add an analysis that is not limited to a single advanced country or region but encompasses most of the world countries. Doing so reveals, for example, that the slight re-bouncing after 2030 that aging would predict for the euro area considered as a closed economy – due to the progressive absorption going forward of the demographic imbalance caused by the baby boomers – is not there for the world as a whole (compare the continuous and dashed-dotted lines in Figure 2). The reason is that once the aging process decelerates in European countries, in other countries such as China and India the same process speeds up exerting further downward pressure on the world real interest rate. I further add the presence of two sectors, so that the model’s results incorporate, for example, the channel – mentioned already by Hansen (1939) in formulating the “secular stagnation” hypothesis – whereby populating aging can exacerbate deficient investment demand by tilting consumption demand towards services that are relatively less capital intensive.

The key to evaluate the quantitative impact of aging on the real interest rate across different sensitivity analyses is the intertemporal elasticity of substitution in consumption (dotted lines in Figure 2). Lower (higher) values of this elasticity imply a stronger (weaker) downward pressure of aging on the real interest rate as individuals need bigger (smaller) changes in the real interest rate to substitute consumption over time. Unfortunately, there is no clear-cut consensus on the value of this parameter. The degree of substitutability between capital and labor in production is also important for the quantitative estimate. In the limit, when capital and labor are perfect substitutes there is no impact of aging on the real interest rate. Throughout my analysis, I have assumed a unitary value for the parameter governing the substitutability between labor and capital, which is a conservative number with respect to the empirical literature.2

Figure 2: World real interest rate, empirical trend vs predicted by demographic change
Percentage point deviations, [1986=0]
 width=

Notes: Trend in the world real interest rate for safe and liquid assets estimated by Del Negro et al. (2019) – DGGT. Overlapping generation model’s simulation – where demographic change is the only exogenous driver – for the baseline 18 countries (world) and the euro area modelled as a closed economy. Dotted lines show the result of simulations where the inverse of the elasticity of intertemporal substitution in consumption (e.i.s) is higher (lower) than in the baseline by 0.5 percentage points at 1.5 (0.5).

Quantitatively, in my model population aging can explain more than 50% of the estimated decline of the trend in the world real interest rate since the end of the 1980s, according to the central estimates. Importantly, populating aging leads to a downward impact of about 2 percentage points in the long-run due to permanently lower population growth rates and permanently higher survival probabilities. Remarkably, these numbers result by assuming that all countries increase the tax rate on labor income to keep the initial level of generosity of the pension systems in the face of an increasing pool of retirees. Should countries reduce the generosity, the real interest would decrease even more as the crowding-out effects on the accumulation of capital stemming from higher taxation would vanish.

These dynamics support the “secular stagnation” view (e.g. Eggertsson et al., 2019) whereby aging is one of those structural forces which – if not countervailed by offsetting policies – could lead to a low “natural” real interest rate – the one that prevails when output is in line with its potential in the presence of flexible prices (Woodford, 2003). As central banks pursue a targeting of inflation at low levels and given the constraint associated with the effective lower bound on the policy rates, this could imply that the actual real interest rates cannot decrease enough to reach the level that would ensure full employment. Under such circumstances, aging would be disinflationary rather than inflationary as predicted by Goodhart and Pradhan (2020).

2. Global imbalances

Each country reacts to its own idiosyncratic aging process with a willingness to save more and invest less, namely with a willingness to run a current account surplus (i.e. the difference between aggregate savings and investment). However, by definition, it is not possible that all countries run current account surpluses contemporaneously. How does the external wealth of nations evolve in response to aging?

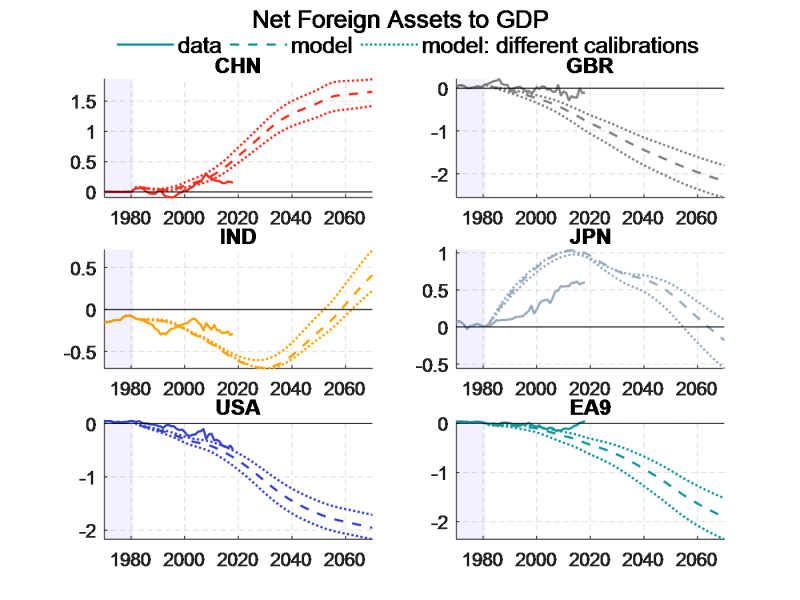
To answer this question, the model matches by design the observed levels of the net foreign asset (NFA) to gross domestic product (GDP) in each country in 1981 (the first year data are available for all countries including China). What is key to determine the capital flow patterns is the fact that population aging differs substantially across countries by timing, extent and speed (Figure 1). From the analysis it turns out, for example, that since Japan is the country that has aged the most since the 1980s it is also the country that has understandably developed the most positive NFA to GDP ratio both in the model and in the data (Figure 3.a). Going forward, the Japanese NFA positions should revert as the aging process of China gets prominence.

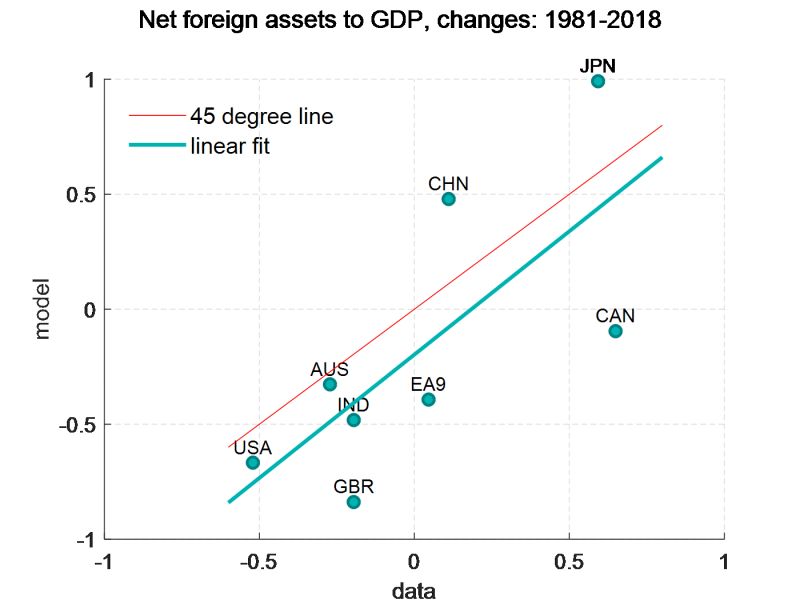
Figure 3: Net foreign assets (NFA) to gross domestic product (GDP), data vs predicted by demographic change

 width=  width=
(a) (b)

Notes: Dynamic simulation of the OLG model targeting the NFA to GDP of each country in 1981 (initial stationary equilibrium). Different calibrations encompassing different initial levels of the real interest rates with (numerical) recalibration of the country-specific individual discount factors to match the initial NFA to GDP levels.

In fact, China is the only country whose NFA to GDP grows sizably positive in the next three decades owing to its marked acceleration of the aging process while still being a relatively young country compared to most of the trading partners. Population size matters too. If a comparably smaller country had to face the same acceleration, its trading partners would not face such a negative development in their NFA positions as the ones predicted for the United States and European countries. As India accelerates the aging process too, its NFA position turns positive late in the projected horizon with a development that sees China and India becoming the sole net creditors of the world by the end of the twenty-first century. Through the lens of the model, it seems that due to demographic changes, Bernanke (2005)’s “global savings glut” has just begun (as also analyzed very recently by Auclert et al., 2021).

Of course, many caveats apply to these predictions, including the fact that some regions of the world – such as African countries – are excluded from the analysis while they might prove to be important for capital flows in the twenty-first century. Magnitudes are somewhat sensitive to the initial calibration strategy. Certain simplifying assumptions – such as the one on how redistribution of (accidental) bequest occurs in the economy and the way individuals perfectly discount the future – might be key for the quantitative performance of the model. Going forward, unpredictable pension system reforms might be crucial as well. For example, in the working paper, I show that if China and India increase over time the generosity of their pension systems while the other countries reduce it, there would be an attenuation of global imbalances. Yet, the model gets the direction of capital flows remarkably well in the period data can be compared with (Figure 3.b). While many drivers other than demographics can impinge on capital flows, demographic change seems a key one to explain the build-up of global imbalances in the NFA positions since the 1980s and their likely persistence in the twenty-first century.

3. Structural transformation

Population aging can also provide an explanation for the systematic reallocation of resources away from the goods (tradable) sector towards the services (non-tradable) sector, the so-called “structural transformation”. Analyzing data from the Consumer Expenditure Survey in the U.S., one can easily find that the fraction of consumption expenditures devoted to non-tradable items increases with age (Cravino et al., 2021; Giagheddu and Papetti, 2018). These include mostly “Health”, “Utilities” and “Domestic care” while tradable items as “Vehicle Purchases”, “Leasing”, “Gasoline and Motor Oil” are more heavily consumed by the young. Therefore, as the population distribution tilts in favor of older individuals, the economy experiences a shift of the relative aggregate demand in favor of non-tradables.

In my working paper, I show that this demand-composition effect of aging can bring about some reallocation of resources away from the tradable sector. Yet, the general equilibrium reduction of the real interest rate tends to dampen this effect by making savings less profitable thus lowering consumption at older ages, in turn reducing the possibility of the elderly demand composition to influence the sectoral reallocation of resources towards relatively more non-tradables.

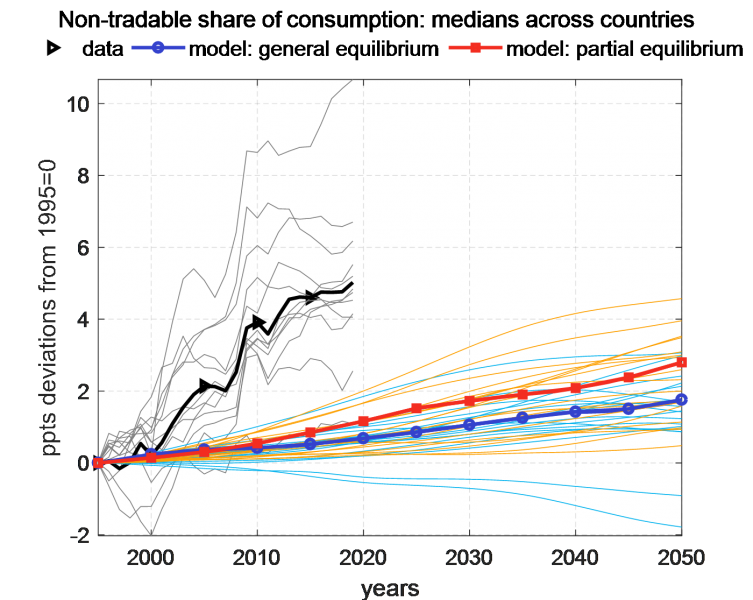
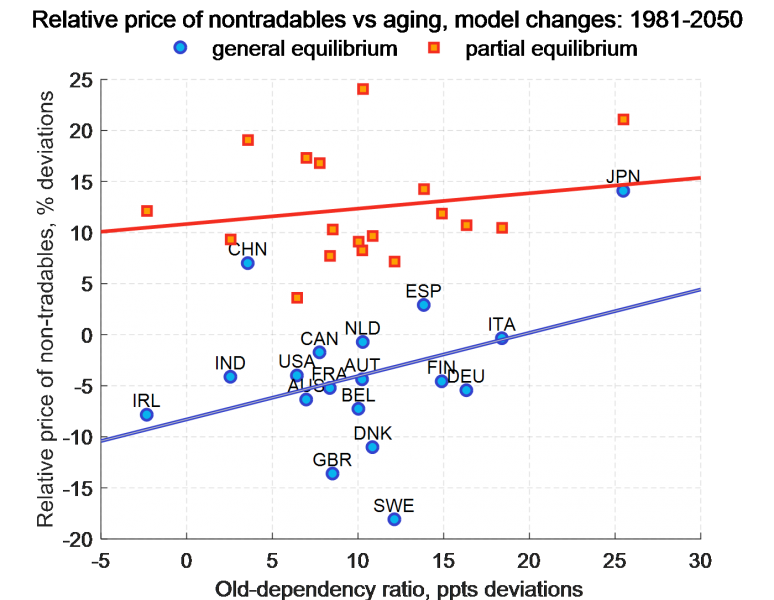
Figure 4: Consumption share and relative price of non-tradables

 width=  width=
(a) (b)

Notes: data on sectoral consumption from EUROSTAT (available period: 1995-2019; available countries: AUT, BEL, DEU, DNK, GBR, IRL, ESP, FIN, FRA, ITA, NLD, SWE): “Final consumption expenditure of households by consumption purpose (COICOP 3 digit) [nama 10 co3 p3]”; “Final consumption expenditure of general government” of the “GDP and main components (output, expenditure and income) [nama 10 gdp]”.

The median non-tradable share of consumption has grown by about 5 percentage points in the data from 1995 (the first year comparable data are available) to 2019. I quantify that in general equilibrium, population aging can account for about 13% of this increase. If aging does not induce a decrease of the real interest rate, i.e. considering a partial equilibrium where the real interest rate stands fixed at the initial level, the figure would be 22% (Figure 4.a).3 The bigger the shift of relative demand, the bigger the reallocation of labor and output from the tradable to the non-tradable sector. In turn, such a reallocation tends to be associated with an increase of the relative price of non-tradables depending on the degree of sectoral labor mobility in each country. The less mobile labor is, the bigger the increase of the relative wage in the non-tradable sector, then reflected in the relative price, to attract relatively more workers to meet the increased consumption demand there. The model, both in general and partial equilibrium, generates a positive co-movement between the growth rate of the old-dependency ratio and the relative price of non-tradables, thus predicting that countries aging more will tend to have a more appreciated real exchange rate (Groneck and Kaufman, 2017; Giagheddu and Papetti, 2018).

Aging and savings

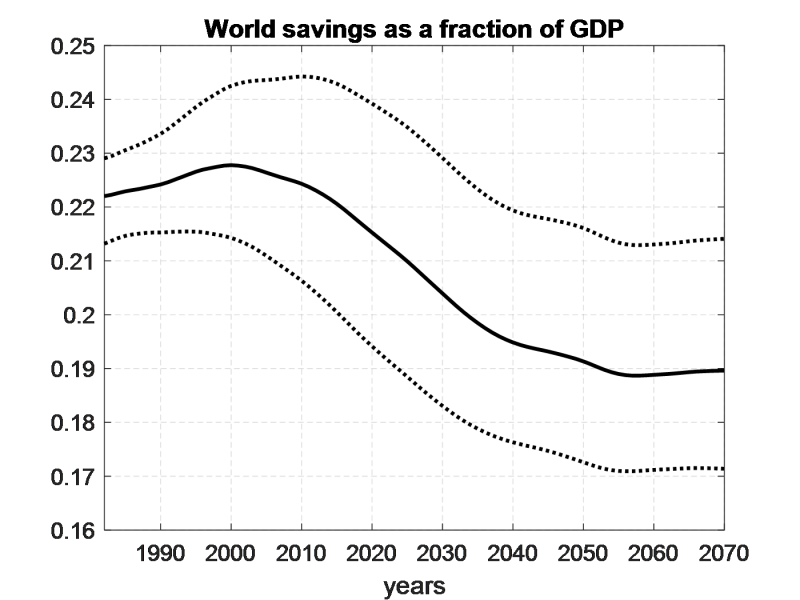
Quite often, a rebuttal to the (aging-induced) saving-glut hypothesis is that the world saving rate has not been trending upwards since the 1980s.4 Yet, from a theoretical point of view, an increased willingness to save by individuals – here associated with the discounting of higher survival probabilities – does not need to translate into a higher saving rate in equilibrium (Pettis, 2017). Indeed, the OLG model predicts that population aging leads to a decrease of the world saving rate (equal to the world investment rate) by about 3 percentage points in the long-run compared to the 1980s (Figure 5).


Figure 5:
World saving rate predicted by demographic change

 width=
Notes: Dynamic simulation of the OLG model with the baseline calibration. Dotted lines show the result of simulations where the inverse of the elasticity of intertemporal substitution in consumption (e.i.s) is higher (lower) than in the baseline by 0.5 percentage points at 1.5 (0.5).

How can a decreasing equilibrium real interest rate be compatible with a decreasing saving rate? The answer lies in the deceleration of population and, in particular, of the effective labor force, which progressively leads to a smaller demand for capital investment. Hence, even though along the transition a rising proportion of elderly – who tend to be dis-savers – could decrease the saving rate and increase the real interest rate ceteris paribus, forces associated with lower investment demand lead, in general equilibrium, to both lower saving rates and real interest rates. For this reason, to evaluate the total effect of demographic change, it is important to consider not only the savings behavior by households (as done by e.g. Mian et al., 2021, for the United States) but also the investment demand by firms in a general equilibrium framework (Auclert et al, 2021, section 5).

Conclusion

Population aging leads to a willingness to save more and invest less and to a relative increase in the demand for non-tradables. Through the lens of a quantitative theoretical model of the world economy, I show that aging can explain significant portions of three key macroeconomic global trends since the 1980s. According to the central simulation, it can account for: (a) more than 50% of the world trend decline in the real interest rates (secular stagnation); (b) most of the growing imbalances in the net foreign asset positions across countries (global imbalances); (c) up to a fifth of the sectoral reallocation of resources away from the goods (tradable) sector (structural transformation). Based on the most recent demographic projections, the model predicts no reversal of these trends in the twenty-first century.

References

Acemoglu, D., and Restrepo, P (2021): “Demographics and Automation”, The Review of Economic Studies, forthcoming.

Auclert, A., Malmberg, H., Martenet, F., & Rognlie, M. (2021): “Demographics, Wealth, and Global Imbalances in the Twenty-First Century”, NBER Working Paper No. 29161.

Bernanke, B. S. (2005): “The global saving glut and the U.S. current account deficit”, Speech 77, Board of Governors of the Federal Reserve System (U.S.). Homer Jones Lecture.

Basso, H. S., and Jimeno, J. F. (2021): “From secular stagnation to robocalypse? Implications of demographic and technological changes”, Journal of Monetary Economics, 117, 833-847.

Bielecki, M., Brzoza-Brzezina, M., and Kolasa, M. (2020): “Demographics and the natural interest rate in the euro area”, European Economic Review, 129:103535.

Chirinko, R. S. (2008): “σ: The long and short of it”, Journal of Macroeconomics, 30(2), 671-686.

Cravino, J., A. A. Levchenko, and M. Rojas (2021): “Population aging and structural transformation”, American Economic Journal: Macroeconomics, forthcoming.

Del Negro, M., Giannone, D., Giannoni, M. P., and Tambalotti, A. (2019): “Global trends in interest rates”, Journal of International Economics, 118(C):248–262.

Eichengreen, B. (2014): “Losing interest”, Project Syndicate, April 11.

Eggertsson, G. B., Mehrotra, N. R., and Robbins, J. A. (2019): “A Model of Secular Stagnation: Theory and Quantitative Evaluation”. American Economic Journal: Macroeconomics, 11(1):1–48.

Gagnon, E., Johannsen, B. K., and Lopez-Salido, D. (2021): “Understanding the new normal: The role of demographics”, IMF Economic Review, pages 1–34.

Giagheddu, M. and Papetti, A. (2018). Demographics and the real exchange rate. Stockholm School of Economics. Manuscript, latest version available at SSRN: 3358551.

Goodhart, C. and M. Pradhan (2020): “The Great Demographic Reversal: Ageing Societies, Waning Inequality, and an Inflation Revival”, 1st ed., Cham, Switzerland: Palgrave Macmillan.

Groneck, M. and Kaufmann, C. (2017): “Determinants of relative sectoral prices: The role of demographic change”, Oxford Bulletin of Economics and Statistics, 79(3):319–347.

Hansen, A. H. (1939): “Economic progress and declining population growth”, The American Economic Review, 29(1):1–15.

Mian, A. R., Straub, L., and Sufi, A. (2021): “What Explains the Decline in r*? Rising Income Inequality Versus Demographic Shifts”, University of Chicago, Becker Friedman Institute for Economics Working Paper, 2021-104.

Papetti, A. (2021a): “Demographics and the natural real interest rate: historical and projected paths for the euro area”, Journal of Economic Dynamics and Control, 132 (2021) 104209.

Papetti, A. (2021b): “Population aging, relative prices and capital flows across the globe”, Bank of Italy Working Paper No. 1333.

Pettis, M. (2017): “Why a savings glut does not increase savings,” Technical Report, Carnegie Endowment for International Peace.

Rachel, L. and Summers, L. H. (2019): “On Secular Stagnation in the Industrialized World”, Brookings Papers of Economic Activity.

Sudo, N. and Takizuka, Y. (2020): “Population Ageing and the Real Interest Rate in the Last and Next 50 Years – A tale told by an Overlapping Generations Model“, Macroeconomic Dynamics, 24(8):2060–2103.

United Nations (2019): “World Population Prospects 2019”, Online Edition. Rev. 1. United Nations, Department of Economics and Social Affairs, Population Division.

Woodford, M. (2003): “Interest and Prices: Foundations of a Theory of Monetary Policy”. Princeton University Press. Princeton, N.J.; Woodstock, Oxfordshire England.

  • 1.

    See e.g. Eggertsson et al. (2019), Gagnon et al. (2021) for the United States; Bielecki et al. (2020), Papetti (2021a) for the euro area; Sudo and Takizuka (2020) for Japan.

  • 2.

    Some speculate that with growing adoption of automation technologies capital can be more easily a substitute of labor thus challenging the downward impact of aging on the real interest rate (see Acemoglu and Restrepo, 2021; Basso et al., 2021). However, most of the empirical evidence points to an ample degree of complementarity between capital and labor (see Chirinko, 2008).

  • 3.

    These numbers are in line with the empirical findings by Cravino et al. (2021) for the United States who quantify that “changes in the age-structure of the population accounted for 20% of the observed change in the service expenditure share over this period [1982–2016].

  • 4.

    See e.g. Eichengreen (2014): “There is only one problem: the data show little evidence of a savings glut. Since 1980, global savings have fluctuated between 22% and 24% of world GDP, with little tendency to trend up or down”.

About the authors

Andrea Papetti

Andrea Papetti (PhD Economics, Stockholm School of Economics; MSc and BSc Economics, Bocconi University) is an economic advisor at the Directorate General for Economics, Statistics and Research of the Bank of Italy. He has previously worked as an economist at the European Central Bank. His main research is in the fields of monetary and international macroeconomics. https://sites.google.com/view/andreapapetti/home

More on these topics

Tags: