Inflation has persistently undershot central bank targets despite more than a decade of stimulus to revive it. Yet we see three new forces that may lead to a higher inflation regime than many investors are expecting.
Covid-19 is both a demand and supply shock. The sudden drop in spending was a clear disinflationary factor. Yet there was also a sudden reduction in supply – and this could be more enduring. We see reasons why the multiple negative supply shocks stemming from Covid-19 may dominate, leading to rising costs and stirring inflation. These shocks may be felt hardest in contact-intensive services, with material capacity reductions due to tighter health and safety regulations. A notable share of activity could simply cost more to provide as a result of reduced capacity, from dentists to restaurants, forcing companies to put up prices to survive. The result? Production costs appear set to increase globally in a pronounced – albeit one-off – fashion, potentially raising headline inflation sooner than many investors expect.
Remapping global supply chains to achieve greater resilience is also poised to become an important factor driving inflation higher, especially for manufacturers. More resilient value chains can withstand disruptions – such as regional virus outbreaks – and may provide a cushion in the long run. But this comes at a cost. So even sectors less directly affected by Covid-19 may still face higher production costs in the medium term.
We believe these forces accelerate an existing trend of deglobalization – and act as a negative supply shock. Three factors are at play. First, local production costs begin to matter again in deglobalization as global value chains are partially dismantled and production is shifted to higher-cost areas. Second, reduced competition may embolden firms to raise their prices when domestic cyclical pressures increase. Third, domestic workers could gain greater bargaining power on wages amid less offshoring or hiring of migrant labor. That is especially true in places where the political pendulum is swinging toward addressing inequality. This may take the form of higher minimum wages and taxes. That would make wages more sensitive to domestic slack and pricing pressures.
As a result, inflation could be permanently higher. There may be a fundamental shift in wage and price setting, with workers being able to demand higher wage increases and firms responding with higher price rises. This would unwind some of the trends seen over the past few decades, when globalization was a disinflationary force. Our work shows a common global factor explaining a high share of variation in goods prices and headline inflation in developed market (DM) economies, while services prices are determined more by local factors. See the chart below. Unpicking the drivers is tricky, but various studies point to the importance of trade flows, commodity prices tied to the rising influence of China and emerging market (EM) economies, more globally integrated supply chains and diminished bargaining power of local workers.
The impact on inflation could be material – both on the rate of inflation and its volatility in major economies. A decline in non-commodity import prices helped reduce annual headline inflation by 0.2-0.5 percentage points in the U.S. and the euro area from 1995-2005, according to a 2008 OECD study. And since companies could be more exposed to domestic shocks with reduced ability to diversify through global supply chains, this could bring sharper swings in prices. A 2018 OECD simulation shows that unwinding the global tariff reductions since 1990 could reduce labor productivity in the U.S. by 4.2%, in the euro area by 3.3% and the OECD as a whole by 4.3%., pushing up on production costs.
Global inflation drivers and deglobalization
Domestic inflation explained by global factors, 1990-2015
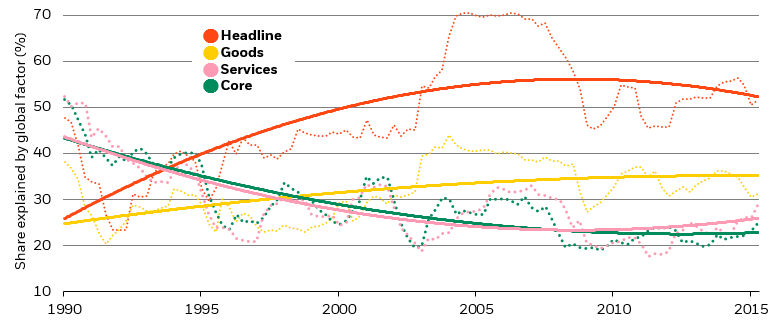
Sources: BlackRock Investment Institute, IMF, OECD, Eurostat, U.S. Bureau of Economic Analysis and Bureau of Labor Statistics, with data from Haver Analytics. Notes: The chart shows how much of the variation of domestic quarterly inflation rates can be explained by global factors for Australia, Canada, Switzerland, Germany, Denmark, Spain, France, UK, Italy, Japan, South Korea, Netherlands, Norway, New Zealand, Portugal, Sweden and the U.S. We determine this by seeing how much of the variation is explained by a common factor (principal component) across these economies. We use a rolling five-year window to estimate the common variation, and the horizontal axis indicates the window starting point. The solid lines are trend lines fitted to the dotted lines.
In addition to deglobalization causing higher production costs, the rise of so-called superstar companies – where the winning companies take all or most of market share – is likely to lead to a further reduction in competition and greater pricing power for the largest firms. Faced with higher production costs, as we discussed on the previous page, superstar companies will have greater scope to pass them on to consumers.
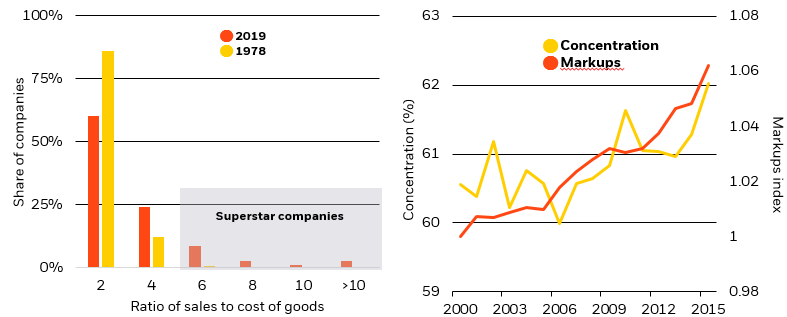
A number of factors have caused market concentration to increase in the past few decades – especially in the U.S. First, more M&A activity – especially large mergers – tends to result in higher industry concentration (see van Reenen 2018). Second, superstar companies – with a high ratio of sales to cost of goods – tend to offer cheaper and better products and services, supported by faster productivity growth in industries with rising concentration. Third, superstar companies often invest more in intangibles – such as research – that help determine the competitive advantages of highly productive companies. The chart on the left below shows the rise of superstar companies within the Russell 1000 equity index. A few decades ago, there were very few companies that could increase their sales relative to product costs at ratios above four. Now that is much more common – an indicator of market power.
Most developed market (DM) economies have seen a sharp increase in market power between 1980 and 2016 (see Diez et al. 2018). Markups started higher in the U.S. than elsewhere in the 1980s and have accelerated recently. While more modest in Europe, there is a clear upward trend. Higher markups have gone hand in hand with increased concentration – superstar companies accounted for the recent increase, with little change for smaller companies. See the chart on the right and Bajgar et al. 2019. So far, increased concentration and higher markups have coincided with sharp increases in profit margins rather than higher consumer price inflation. But this is likely to change. As deglobalization makes it harder for superstar companies to leverage economies of scale, they might increase domestic prices to protect profits.
The U.S. corporate sector is likely to feel this the most. It is directly affected by protectionist measures and the aggregate markup is almost twice as large as in other DMs. The rise in markups over time is mostly explained by increases among the incumbents and less by new high-markup entrants. About 70% of the markup increase between 2000 and 2015 is explained by incumbents, according to an April 2019 IMF study.
With time, superstar companies could also become less efficient, less innovative and increasingly behave like monopolists. Rising markups have historically been associated with greater investment and innovation – but only up to a point. Beyond a certain concentration, this pressure wanes. We have already seen productivity growth slow and increased bifurcation within the corporate sector since the global financial crisis (GFC). In addition, the increase in market power has been accompanied by a drop in the labor share of income – partly explaining subdued wage pressures in major economies (see Autor et al 2019). Technology has played a role in the disinflation of the past few decades. Yet increased concentration could start to reverse some of these gains in coming years.
| Superstar companies Company markups in Russell 1000 index, 1978-2019 |
Increased pricing power Industry concentration and price markups, 2000-2015 |
|
 |
||
Sources: BlackRock Investment Institute, with data from Refinitiv Datastream. Notes: The chart shows the companies in the Russell 1000 divided into buckets based on the ratio of their sales versus cost of goods. This helps break out the companies that have the means to pass on markups on their products. For example, nearly 90% of companies in the index had a ratio of two in 1978 but that fell to 60% by 2009. We judge those with a ratio above six to be in the category of superstar companies given how historically rare it has been to pass on such sizable markups. |
Sources: BlackRock Investment Institute, IMF and Orbis. Notes: The chart shows price markups and industry concentration of more than 1 million firms across 27 major economies based on the IMF ‘s April 2019 World Economic Outlook chapter two “The Rise of Corporate Market Power and its Macroeconomic Effects.” Concentration is computed as the ratio of sales of top four to top 20 companies. Markups are calculated based on the approach of De Loecker and Warzynski (2012). The index is rebased so that the year 2000 = 1. |
|
Major central banks are reviewing their monetary policy frameworks and are in the process of adopting new ones. A key objective behind these reviews is to lift inflation and inflation expectations sustainably back to their targets. Another is to regain sufficient policy space. These reviews and evolution point to an intent to have a higher inflation regime.
The Federal Reserve announced in August this year that it would embark on a flexible average-inflation targeting regime and that a tight labour market will no longer be a factor in determining the policy stance. The European Central Bank is set to announce changes to its policy framework next year.
The Fed’s new framework is moving beyond inflation targeting and is now embracing a form of “make-up” strategy. See our review from June 2019. This implies that the Fed is now committing to push inflation above target for some time to make up for the systematic undershoot in recent years. If credible, we believe this framework change is desirable. There is an important self-fulling element to inflation: what people think inflation will be ends up being a key determinant of what inflation turns out to be. Our research shows that expectations have become the main driver of inflation over the past few years. The intent of these make-up strategies is to prevent a streak of below-target inflation becoming entrenched in lower inflation expectations. With this new framework, when inflation surprises on the downside we should expect more inflation in future, not less. Deliberately overshooting would have been inconceivable in the aftermath of 2008 when the Fed calibrated the then unprecedented expansion of its balance sheet to get inflation back to target, not above. The Fed’s published inflation expectations then did not show any deliberate effort to overshoot.
What are the long-term implications? It is difficult to be precise because the new framework is loose – in fact, looser than it was before. How much will the Fed allow inflation to overshoot – and for how long? Many more policy paths are possible, but one thing is certain: making up for past inflation misses implies easy monetary policy for longer. The Fed should want inflation to run systematically above 2% during normal times to compensate for the inevitable undershoot that will occur when interest rates are stymied by their effective lower bound. Using the same method of Bernanke 2017 to see what impact looser monetary policy for longer would have, our analysis suggests that average inflation could rise by 0.75-1 percentage points with the new strategy. This is substantial – and amounts to a new inflation regime.
The other major change is the way labor market changes will influence monetary policy. The Fed has introduced an explicit asymmetry, stating that from now on it will be concerned only by the “shortfall” from full employment. The Fed is drawing the right lesson from recent experience when an apparently tight labor market – with the unemployment rate hitting multi-decade lows – did not necessarily signal an imminent rise in inflation. But while a tight labor market is not the sole driver of inflation, it has been at times in the past. We see the Fed’s framework as institutionalizing a specific but unstable regime: that the relationship between the labor market and inflation has vanished. This asymmetric treatment of the labor market will make it harder to build the case for a pre-emptive strike on inflation – of the sort that former Fed Chair Alan Greenspan launched in the 1990s and was largely credited for. This contributes to higher inflation risks.
Central banks would need to be successful at lifting inflation from its stubbornly below-target level before the higher inflation risk materializes. Having consistently fallen short for more than a decade, there is understandable scepticism about the ability of central banks to lift inflation – and therefore about the upside risks. But instead of the huge demand shock of the past decade, causing one of the weakest recoveries on record, the backdrop ahead is one of rising production costs as discussed on previous pages. Our baseline is not that inflation gets out of control. Yet annual inflation over 2.5% on average will be significantly higher than market participants currently expect. See the chart.
A higher inflation regime
U.S. inflation market pricing vs. our inflation estimate, 2015-2025
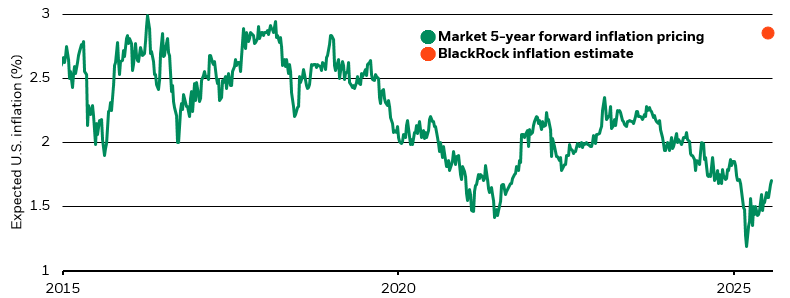
Forward-looking estimates may not come to pass. Sources: BlackRock Investment Institute and the Federal Reserve with data from Refinitiv Datastream., September 2020. Notes: The chart shows market pricing of expected average inflation over the five-year period starting in 2025. We show it using the five-year/five-year inflation swap which is a measure of market expectation of inflation over five years, starting in five years’ time. In the chart, the line is shifted forward five years. The orange dot shows our current estimate of average U.S. CPI for the same five-year period of 2025-2030.
Something even bigger at play could cause inflation expectations to become unanchored at a time when they might already be rising. This is not about rampant inflation that could come with unprecedented central bank balance sheet expansion, the fear articulated by some commentators during the GFC and never materialized. This is about a risk to the nominal anchor – central banks losing grip of inflation expectations relative to their target levels – without proper policy guardrails and a clear exit strategy from current stimulus measures.
The joint fiscal-monetary coordination in response to the Covid-19 shock is nothing short of a policy revolution. The coordination between monetary and fiscal policy is a fait accompli. The implicit, if not explicit, move toward yield curve control – targeting government bond yields at low levels – is motivated by a desire to avoid a sudden surge in yields during this unprecedented rise in peacetime debt. Central banks can justify these actions within their current inflation objectives – especially in the absence of upside inflation surprises over the past decade. As we wrote in August 2019, we think this was required and inevitable. But we cannot take anchored inflation expectations for granted.
After more than 30 years, well-anchored inflation expectations are increasingly taken as a market fundamental. Yet in the past it was precisely when anchored inflation expectations were taken for granted that they became unanchored – as happened in the 1960s and 1970s. See the chart below. In the 1960s, with inflation assumed to be anchored and unresponsive to a tight labour market, prioritizing full employment became the political consensus. But as this political consensus became clear, inflation expectations started to drift higher, driving inflation. And a significant increase in the cost of production – the oil price shocks of the early 1970s – added fuel to this inflationary fire, as below. The painful lesson from this episode: even if inflation appears under control, guardrails are essential to maintain the credibility of the inflation anchor and avoid the political pressures to create an inflationary bias. This was the genesis of the rational expectations revolution in economics – that people’s expectations are shaped by what policymakers are trying to do – the Lucas critique in 1976 and thus the move to shield monetary policy from political pressures to overstimulate.
The problem may arise when central banks succeed in pushing inflation above target. Without a clear framework, central banks could now find it more difficult to lean against higher inflation. The blurring of fiscal and monetary policy means the decision to start tightening monetary policy will be more politicized. When looking at the concrete debt servicing cost of tightening monetary policy, the less tangible – but no less real – risk of loosening the grip on inflation expectations will pale in comparison. And it will be harder for central banks to persuade the public of the need to lean against inflation. If it is fine to overshoot the target for some time, why not some more? If going up to 2.5% is acceptable, why not 3%? The Fed will be less able to appeal to a tight labour market anymore even if is it building inflationary pressures. This makes it harder to stave off political pressures. The underlying inflation dynamics at play, combined with perceived constraints on central banks to raise interest rates in an environment of rising and elevated debt, could raise doubts about the credibility of inflation targets. Anchoring inflation expectations is about confidence in the central bank. Once lost, it is hard to regain – as the experience of the late Fed Chair Paul Volcker showed in 1980s. That is why there is the risk of a self-fulfilling cycle of higher inflation and inflation expectations without clear guardrails around the fiscal-monetary coordination.
Financial markets react more quickly to changes in future macro behavior than the public, so investors may need to adjust portfolios well before the changes appear in the data. Any strategic asset allocation decisions should be taken now rather than when inflation expectations shift: see Readying for real resilience from August 2019 for how we implement our inflation views in strategic portfolios. Once higher inflation appears, it’s likely going to be too late – markets may have already moved to price in higher inflation expectations. Current breakeven inflation rates suggest this has not happened yet, opening a window of opportunity for long-term investors relative to our inflation expectations.
Losing grip on inflation expectations
U.S. Phillips curve, 1958-1971
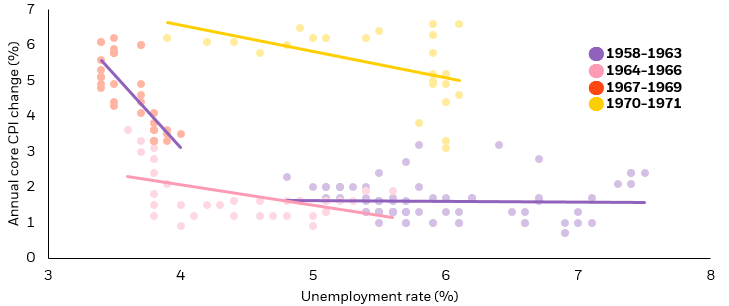
Sources: BlackRock Investment Institute and U.S. Bureau of Labor Statistics, with data from Refinitiv Datastream. Notes: The chart plots the cross of the annual change in the core Consumer Price Index (CPI) against the unemployment rate – the Phillips curve.
BlackRock disclosure
This material is reprinted with permission of BlackRock. This material is intended for professional and institutional clients only. The opinions expressed in this reprint are not intended to be relied upon as a forecast, research or investment advice, and is not a recommendation, offer or solicitation to buy or sell any securities or to adopt any investment strategy.
The opinions expressed are as of December 2020 and may change as subsequent conditions vary. The information and opinions contained in this material are derived from proprietary and nonproprietary sources deemed by BlackRock to be reliable, are not necessarily all-inclusive and are not guaranteed as to accuracy. As such, no warranty of accuracy or reliability is given and no responsibility arising in any other way for errors and omissions (including responsibility to any person by reason of negligence) is accepted by BlackRock, its officers, employees or agents. This material may contain ’forward looking’ information that is not purely historical in nature. Such information may include, among other things, projections and forecasts. There is no guarantee that any forecasts made will come to pass. Reliance upon information in this material is at the sole discretion of the reader. You can access the original article here.
Capital at risk: The value of investments and the income from them can fall as well as rise and are not guaranteed. The investor may not get back the amount originally invested.
Past performance is not a reliable indicator of current or future results and should not be the sole factor of consideration when selecting a product or strategy. Changes in the rates of exchange between currencies may cause the value of investments to diminish or increase. Fluctuation may be particularly marked in the case of a higher volatility fund and the value of an investment may fall suddenly and substantially. Levels and basis of taxation may change from time to time.
©2020 BlackRock, Inc. All Rights Reserved. BlackRock® is a registered trademark of BlackRock, Inc., or its subsidiaries in the United States and elsewhere. All other trademarks are those of their respective owners.
This Policy Note is a partly updated version of „Preparing for a higher inflation regime“, BlackRock’s macro and market perspectives issued in September 2020. Please see the disclosure below the article.
Elga Bartsch – Head of Macro Research, BlackRock Investment Institute
Jean Boivin – Head, BlackRock Investment Institute
Philipp Hildebrand – Vice Chairman, BlackRock
Contributor: Nicholas Fawcett – Macro research, BlackRock Investment Institute