
Global debt has dramatically risen during the last two decades and it represents an important concern for the world economy since may pose serious threats to macroeconomic, financial, and fiscal stability, which in turn can amplify uncertainty among economic agents. High debt may hinder economic growth especially for those economies with a large debt burden, and it may also amplify the volatility of GDP growth rates. In this policy brief we provide the main results of an empirical analysis that we carried out to investigate the relationships between i) real GDP per capita growth and debt, and ii) GDP growth volatility and debt, during the 1980-2019 period for a sample of 114 countries including advanced economies (AEs) and emerging market economies (EMEs). It emerges that private and government debt are negatively linked to economic growth, while positively to growth volatility. In particular, the indebtedness of the household sector generates the largest changes on GDP growth for both AEs and EMEs, while the debt of non-financial corporations produces the largest changes on growth volatility. An increase in public debt reduces economic growth in EMEs and increases growth volatility in AEs.
Since the outbreak of the 2007-08 global financial crisis many efforts have been put in place by international and national regulatory bodies to implement a sounder financial architecture, and to strengthen the regulation and oversight of the financial system. But new vulnerabilities have emerged, such as differences in policy stances, higher political risks, rising trade barriers, increased geopolitical tensions, high debt, and lastly the pandemic crisis.
Indebtedness among global economies is increasing at a remarkable pace. As reported by the International Monetary Fund, in 2019 global debt was worth US$197 trillion (227% of global GDP, and 30% above the level prevailing before the 2007-08 financial crisis) and after the outbreak of the pandemic crisis global debt reached US$226 trillion at the end of 2020 (256% of GDP).2 In particular, total non-financial debt in jurisdictions with systemically important financial sectors has grown from US$113 trillion in 2008 (more than 200 percent of their GDP) to US$167 trillion in 2018 (almost 250% of their GDP).3 It is well known that leverage can help key institutional sectors, such as households and non-financial corporations (NFCs), to increase consumption, investment, production, and thus foster the real economy. However, rising debt can increase the vulnerability of the non-financial sector and the cost of debt servicing, and can be harmful for real GDP growth in the perspective of debt sustainability.
The relationship between economic growth and debt has been extensively explored in the academia, leading to the main outcome that high debt, mostly government debt, has a negative impact on the growth rate of a country, and in many cases that impact gets more pronounced as debt increases. In this policy brief we report the main outcomes of an empirical research that we carried out to further examine the potential link between economic growth and debt for a sample of 114 countries over the 1980-2019 period, paying attention to what happens when we consider Advanced Economies (AEs) and Emerging Market Economies (EMEs). In addition, we also investigate the existence of a statistically significant relationship between the volatility of GDP growth and debt, as high debt could lead to macroeconomic and financial turmoils, which in turn fuels uncertainty among economic agents in the real sector.4
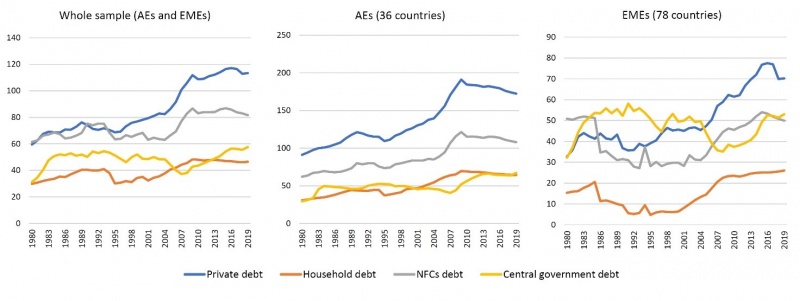
We employ a sample of 114 countries classified as AEs (36 countries) and EMEs (78 countries) according to the IMF.5 The sample includes countries that offer a wide range of variation of macroeconomic variables and debt-to-GDP ratios, over the 1980-2019 period. Macroeconomic data have been collected from the World Bank’s World Development Indicators, and debt-to-GDP ratios from the IMF’s Global Debt Database. Figure 1 plots data of private (household and NFCs sectors) and government debt-to-GDP ratios from 1980 to 2019, for the entire sample, AEs, and EMEs.
Figure 1. Private and government debt-to-GDP ratios (%, 1980-2019)

Note: yearly averaged data. Source: IMF (2021).
Overall private debt of AEs is almost twice than that of EMEs, though emerging economies show a more volatile trend. In 1980 the private debt-to-GDP ratio was 91% for AEs and 33% for EMEs, and in 2000 it rose to, respectively, 126% and 46%. The peak of private debt was reached in 2009 for AEs (191%) and in 2016 for EMEs (78%). In general, the NFCs sector emerges to be much more indebted than the household sector. Government debt, instead, shows different trends according to the group of countries considered. Government debt in AEs is almost a half of total private debt: we observe an almost flat yellow line from the mid-80s to 2007 (around 45-50%), which turns to be upward sloping between 2008 and 2014 (peak of 66% in 2014), and flat again during the most recent years. Indebtedness of the public sector in EMEs is quite more volatile and moves as opposite to private debt: the government debt-to-GDP ratio increases between 1980 and early-1990s, decreases in the second half of 1990s, slightly increases between 1997 (44%) and 2004 (50%), then it declines to 35% in 2008, and finally increases up to 53% in 2019. Government debt in EMEs has been larger than private debt up to 2005, while the opposite occurs after since 2006.
We carry out fixed-effects panel regressions using 5-years moving average data (35 observations per country), which allows to exploit the long time series information and purge cyclical movements.6 Country and time fixed effects are included. We investigate the relationships between i) real GDP per capita growth rates and debt, ii) standard deviation of real GDP per capita growth rates and debt, using four debt-to-GDP ratios, i.e., household, NFCs, overall private (household plus NFCs), and government debt. The set of control variables includes real GDP per capita (natural logarithm), age dependency ratio, inflation, government expenditure as a share of GDP, and trade openness.
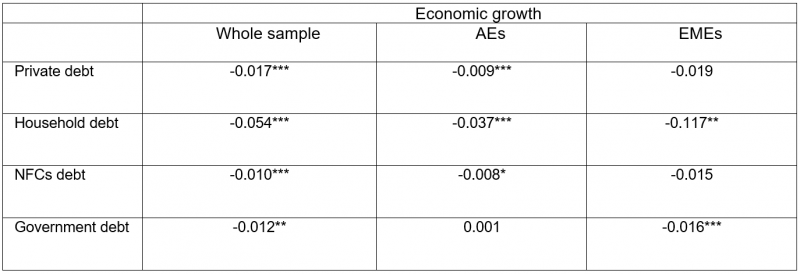
Whole sample estimation results tell us that an increase in debt-to-GDP ratios deteriorates real GDP growth (Table 1, left panel). Household debt shows the largest magnitude (-0.054) followed by overall private debt (-0.017), government debt (-0.012), and NFCs debt (-0.010). AEs suffer the large burden of private debt as shown in Figure 1: according to our estimates, a 1% change in the private, household, or NFCs debt-to-GDP ratio produces, respectively, a -0.009, -0.037 or -0.008 change in real GDP per capita growth rate (see Table 1, middle panel). Interestingly, no statistically significant link emerges between economic growth and government debt in AEs. Negative and statistically significant correlations emerge also for EMEs (Table 1, right panel), where a 1% change in either household or government debt-to-GDP ratios produces, respectively, a -0.117 or -0.016 change in GDP growth rates.
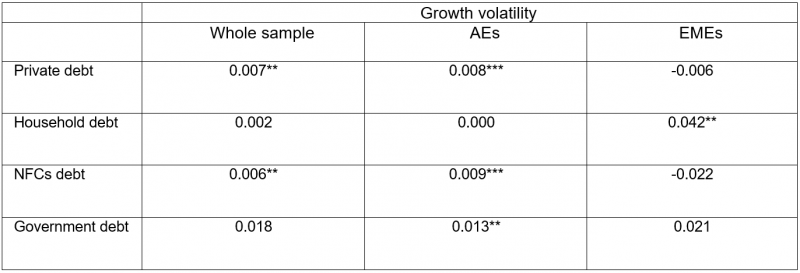
Looking at Table 2, we end up to the broad outcome that private debt contributes to amplify the volatility of GDP growth rates. We observe positive and statistically significant coefficients for overall private debt (0.007 for the whole sample, 0.008 for AEs), household debt (0.042 only for EMEs), and NFCs debt (0.006 for the whole sample, and 0.009 for AEs). Government debt emerges to be statistically significant only for AEs, where a 1% change in the government debt-to-GDP ratio increases the volatility of GDP growth rates by 0.013. It is worth to mention that the indebtedness of the household sector in EMEs has a larger magnitude on growth volatility than other estimated coefficients.
Two broad outcomes emerge from our research: increasing debt can i) harm economic growth, and ii) amplify the volatility of GDP growth rates. These results are confirmed whether we consider the entire sample of 114 countries, or AEs and EMEs separately. Changes in the indebtedness of the household sector generate the largest variations on real GDP per capita growth rates: this is particularly true for EMEs where a 1% change in the household debt-to-GDP ratio produces a -0.117 change in GDP growth rates, compared to a -0.037 change for AEs. Interestingly, no statistically significant relationship emerges between economic growth and government debt in AEs. The analysis of the link between debt and growth volatility leads to the general outcome that private debt is positively linked to the standard deviation of real GDP per capita growth rates. For AEs, it is the NFCs debt to influence growth volatility while household debt does not; the opposite occurs for EMEs, where growth volatility emerges to be influenced only by the indebtedness of the household sector. A positive and significant relationship between public debt and growth volatility emerges only for AEs.
Increasing growth volatility is not necessarily a bad signal, as it may denote a very flexible real sector where households, firms and labor markets quickly adjust to social and technological changes, but it could also denotes periods characterized by high uncertainty and instability.
These hyper-debt signals cannot be neglected by regulatory authorities since they could pose several challenges to economic agents and policy makers in terms of debt financing capacity and sustainability, that can be amplified by adverse exogenous factors such as political and social instability, and recently the pandemic crisis. With high levels of debt, economies should stabilize their debt and rely on robust growth to ensure sustainability, but this seems not to be the case of many AEs, whose average GDP per capita growth rates show a downward trend since 2007. Anyway, private and government debt require different treatments by policy makers according to their different nature. While the overhang of household and corporate debt may end up to default and bankruptcy for households and firms, the excess of government debt can lead to the government inability to deliver essential services for current and future generations.
Table 1: Economic growth and debt

The dependent variable is real GDP per capita growth rate. Country and time fixed effects are included. Estimations of other regression coefficients are not reported for brevity. *, **, *** denote, respectively, statistical significance at 10%, 5% and 1% level.
Table 2: Growth volatility and debt

The dependent variable is the standard deviation of real GDP per capita growth rate. Country and time fixed effects are included. Estimations of other regression coefficients are not reported for brevity. *, **, *** denote, respectively, statistical significance at 10%, 5% and 1% level.
Beck, T., Degryse, H., and Kneer, C., 2014. Is more finance better? Disentangling intermediation and size effects of financial systems. Journal of Financial Stability, 10, 50-64.
Beck T., Chen T., Lin C., and Song F. M., 2016. Financial innovation: The bright and the dark sides. Journal of Banking and Finance, 72, 28-51.
Cecchetti, S. G., and Kharroubi, E., 2012. Reassessing the impact of finance on growth. BIS Working Paper no. 381.
Cecchetti, S. G., Mohanty, M., and Zampolli, F., 2011. The real effects of debt. BIS Working Papers No. 352.
International Monetary Fund (IMF), 2018. A Decade after the Global Financial Crisis: Are We Safer?. Global Financial Stability Report, October.
International Monetary Fund (IMF), 2020. Fiscal Monitor, Policies for the recovery. October.
International Monetary Fund (IMF), 2021. Global Debt Database.
Morganti P., and Garofalo G., 2019. Reassessing the Law, Finance, and Growth Nexus After the Recent Great Recession. Journal of Economic Behavior and Organization, 162, 229-250.
Research fellow at the Department of Economics, Engineering, Society, and Business. Tuscia University (Viterbo, Italy).
E-mail: morganti@unitus.it.
IMF (2020, 2021).
IMF (2018).
See, for instance, Cecchetti et al. (2011) who explored the relationship between GDP growth volatility and debt.
AEs: Australia, Austria, Belgium, Canada, Cyprus, Czech Regovernment, Denmark, Estonia, Finland, France, Germany, Greece, Hong Kong SAR,, Iceland, Ireland, Israel, Italy, Japan, Korea Rep., Latvia, Lithuania, Luxembourg, Malta, Netherlands, New Zealand, Norway, Portugal, San Marino, Singapore, Slovak Regovernment, Slovenia, Spain, Sweden, Switzerland, United Kingdom, United States; EMEs: Albania, Algeria, Angola, Antigua and Barbuda, Argentina, Armenia, Azerbaijan, Bahamas, Bahrain, Barbados, Belarus, Belize, Bolivia, Bosnia and Herzegovina, Botswana, Brazil, Brunei Darussalam, Bulgaria, Chile, China, Colombia, Costa Rica, Croatia, Dominican Regovernment, Ecuador, Egypt, El Salvador, Equatorial Guinea, Fiji, Gabon, Georgia, Guatemala, Hungary, India, Indonesia, Iran Islamic Rep., Iraq, Jamaica, Jordan, Kazakhstan, Kuwait, Lebanon, Libya, Macedonia, Malaysia, Mauritius, Mexico, Mongolia, Montenegro, Morocco, Namibia, Oman, Pakistan, Panama, Paraguay, Peru, Philippines, Poland, Qatar, Romania, Russian Federation, Saudi Arabia, Serbia, Seychelles, South Africa, Sri Lanka, St. Kitts and Nevis, Suriname, Thailand, Trinidad and Tobago, Tunisia, Turkey, Turkmenistan, Ukraine, United Arab Emirates, Uruguay, Venezuela RB, West Bank and Gaza.
This approach has been already adopted in the finance and growth literature. See, among all, Cecchetti et al. (2011) and Kharroubi (2012), Beck et al. (2014), Beck et al. (2016), Morganti and Garofalo (2019).