The Harmonised Index of Consumer Prices (HICP) is the key indicator used to measure price stability, and thus orient monetary policy, in the euro area. The HICP is prone to several sources of measurement error. We focus on mismeasurement at the upper level of aggregation, i.e. mismeasurement linked to the choice of index formula and the use of provisional data in the compilation of expenditure weights. We find that, on average over the period from 1997 to 2019, the upward bias in German inflation is about one-ninth of a percentage point. Around 80% of all deviations fall within a range of 0 to 0.25 percentage point. A methodological change implemented in 2012 has reduced the substitution bias in both the German and euro area HICP. However, evidence for Germany indicates that the use of provisional data in the compilati-on of weights has increased the bias.
However, such adjustments to the expenditure weights of individual items in the basket of goods are generally only reflected in the consumer price index after a certain time lag. Theoretical and empirical research dealing with upper-level aggregation issues found that the bias caused by non-representative weights is generally positive and rather small. For example, Boskin et al. (1998) show in a well-known study that the total bias of the US CPI amounts to 1.1 percentage point per annum, of which only 0.15 percentage point is due to upper-level substitution.
Measurement errors in the HICP
The Harmonised Index of Consumer Prices (HICP) attracts much attention as a measure of inflation in Europe. In fact, the HICP serves as a key metric for gauging price stability, and thus deciding the monetary policy stance adopted in the euro area.
As is the case with any consumer price index (CPI), the HICP is prone to measurement error. Measurement errors can occur in a variety of ways. For example, distortions may be caused by new products being introduced into the basket of goods with a delay or by statistical processes being unable to precisely identify qualitative improvements to products.
In our analysis, we focus on measurement errors in what is known as the upper level of aggregation. These might emerge, for instance, if expenditure for certain goods and services increases or decreases disproportionately over time and these weights thus need to be adjusted in order to ensure that the price index is entirely representative. However, such adjustments to the expenditure weights of individual items in the basket of goods are generally only reflected in the consumer price index after a certain time lag. Theoretical and empirical research dealing with upper-level aggregation issues found that the bias caused by non-representative weights is generally positive and rather small. For example, Boskin et al. (1998) show in a well-known study that the total bias of the US CPI amounts to 1.1 percentage point per annum, of which only 0.15 percentage point is due to upper-level substitution.
Estimation of “true” inflation
In order to quantify mismeasurement at the upper level of aggregation, we compare the official HICP against a benchmark index that is assumed to retrospectively reflect price developments with a greater degree of accuracy than the HICP. Any differences between the HICP and the benchmark index are attributed to measurement errors. While the official HICP is constructed as an annually chain-linked Laspeyres-type index with weights being representative for the previous calendar year, the benchmark index is based on a superlative index formula. A superlative index offers several advantageous statistical properties, such as symmetry in the weighting of the base-period basket and the current-period basket. The part of the measurement bias caused by using these different index forms is called the “substitution component”.
For the derivation of weights, we consider more comprehensive information about households’ final consumption expenditure than the data available at the respective points in time at which the HICP calculated. As a result, we calculated more accurate retrospective weights for the underlying goods and services of the HICP. We refer to the part of the measurement error caused by the deviation between the official HICP expenditure weights and our retrospective weights as the “data vintage component”.
Bias and uncertainty of the German HICP
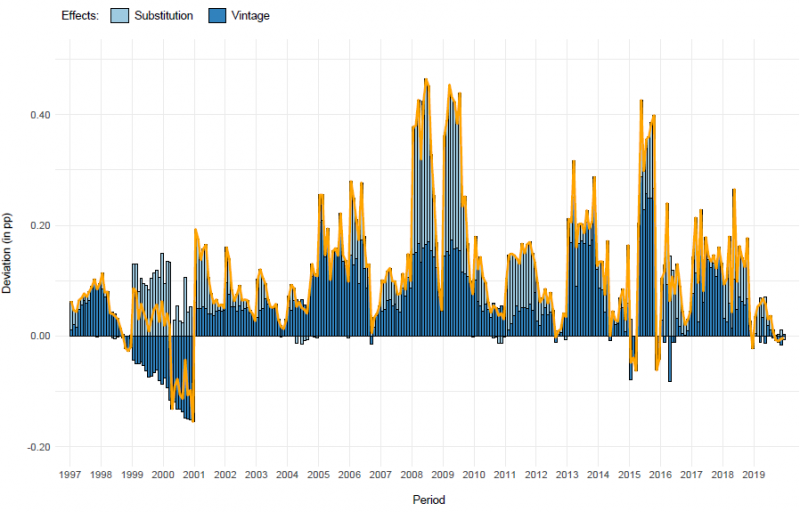
Figure 1 shows the extent of the mismeasurement engendered by the substitution and data vintage components in the period from January 1997 to December 2019. Looking at the monthly realisations, the year-on-year rates of the German HICP deviate from the corresponding rates of the benchmark index by between -0.2 and about 0.5 percentage point, with around 80% of all deviations falling within a range of 0 to 0.25 percentage point.
On average, HICP rates of change are about one-ninth of a percentage point higher than the rates of the benchmark index. As expected by the theory and consistent with existing empirical evidence, the upper-level aggregation bias is positive and small. Over the entire period, the data vintage and substitution components contribute more or less equally to the measurement bias.
Figure 1: Monthly deviations of German HICP due to substitution and data vintage effects
Effect of methodological change in 2012
Of particular interest is the investigation of HICP bias and inaccuracy before and after 2012. In 2012, a new regulation came into force that prescribed the use of detailed household expenditure data from preliminary national accounts in the annual update of weights. This was a major change compared to the situation before 2012 because, until then, weights had only been price-updated in Germany (apart from the incorporation of information taken from the multi-year household budget surveys). Since 2012, the substitution-induced bias has decreased. However, this has been accompanied by a comparable increase in data vintage-induced bias. Hence, while the annual update of weights using quantitative information from the national accounts was a step towards reducing the substitution component of the bias, the methodological change came at the cost of increasing the data vintage component.
Substitution bias in the euro area
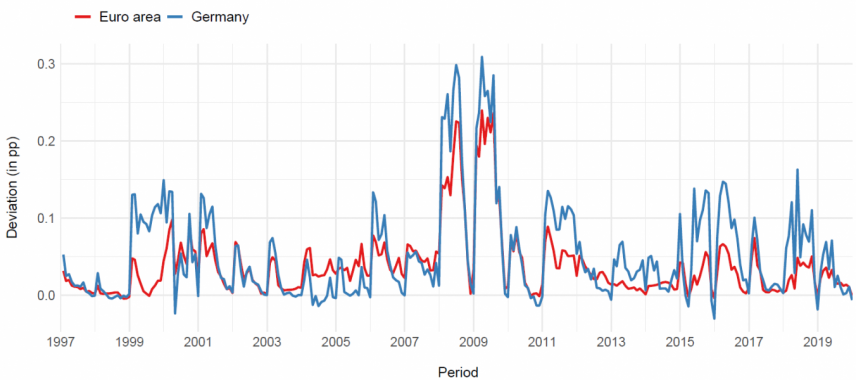
The substitution component of the euro area HICP averages 0.04 percentage point, which is about one-quarter smaller than its German counterpart. The realisations are almost entirely non-negative. The largest substitution bias is observed in 2008 and 2009 – the years of the global financial crisis and the Great Recession. The results for the euro area turn out to be less pronounced than those for Germany. For the euro area HICP, we witness a decline in substitution-related bias due to the 2012 methodological change. However, no findings are obtained with respect to the impact of data vintage due to a lack of data on the euro area HICP.
Figure 2: Monthly substitution components of German and euro area HICPs
Conclusion
The HICP may suffer from mismeasurement due to changing consumption patterns being disregarded and preliminary data being used in the compilation of expenditure weights. Despite methodological improvements, these measurement errors are still present, even though they are rather small, especially in comparison with other sources of mismeasurement. Hence, it appears justified to assume a small, positive bias when accounting for mismeasurement at the upper level of aggregation. More frequent and timely collection of high-quality information about households’ expenditure might help to further reduce HICP mismeasurement at the upper level of aggregation. New data sources such as scanner data and the application of new technologies such as “home scans” could be investigated in this respect. Leading experts in this field argue that, especially during turbulent times such as the coronavirus crisis, conti-nuous consumer surveys would be very much required for calculating meaningful price indices (e.g. Diewert and Fox, 2020).
Boskin, M. J., Dulberger, E. R., Gordon, R. J., Griliches, Z., and Jorgenson, D. W. (1998). Consumer prices, the consumer price index, and the cost of living. Journal of Economic Perspectives, 12(1):3{26. doi: 10.1257/jep.12.1.3.
Diewert, W. E. and Fox, K. J. (2020). Measuring real consumption and CPI bias under lockdown conditions. NBER Working Paper, (27144). doi: 10.3386/w27144.