menu
close

Author(s):

Matthew Luzzetti | Deutsche Bank
Brett Ryan | Deutsche Bank
Justin Weidner | Deutsche Bank
Amy Yang | Deutsche Bank

Keywords:

R-star , neutral rate , Federal Reserve , monetary policy

JEL Codes:

R-star, the neutral level of the real policy rate, has served as an important guidepost for monetary policymakers in recent decades. However, identifying r-star has become far more difficult since the pandemic as heightened data volatility has led to the discontinuation of traditional metrics based on macroeconomic relationships. 
 
We present new estimates of r-star for the US based on a few fundamental macroeconomic variables. The model captures all key features of r-star estimates over the forty years prior to the pandemic. More importantly, it shows that r-star has likely risen to levels that are somewhat above the readings in 2019, with current estimates in the 70-90bps range. All else equal, these findings argue for a higher terminal rate this cycle and against a near-term pivot in Fed policy.


Introduction

R-star, the neutral level of the real policy rate, has served as an important guidepost for monetary policymakers in recent decades. However, identifying r-star has become far more difficult since the pandemic. The pandemic has induced shifts in the economy that are likely to exert countervailing forces on r-star over time, including more forceful fiscal policies, greater reliance on work from home, reduced immigration, and lower participation rates for some.  Moreover, the extreme volatility of the data led to a discontinuation of popular r-star metrics that use a few macroeconomic relationships, like Laubach-Williams (LW) and Holston-Laubach-Williams (HLW).1

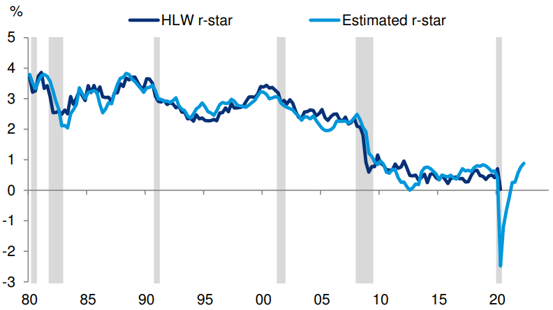
In recent work we used a simple regression framework based on a few fundamental macroeconomic variables to derive new estimates of r-star. Our model fits the pre-pandemic features of HLW r-star very closely. Based on recent developments in these underlying drivers, r-star has likely risen since the pandemic.

A simple macro model of r-star

To identify macro factors that could help predict the value of r-star, it is useful to think about the neutral real rate as a composite of two drivers. The first driver is potential GDP growth, which determines the trend growth rate in the economy and thus the demand / need for investment. The second factor is related to the supply of or demand for savings that are not associated with potential GDP growth, which would tend to lead to deviations of r-star estimates from the economy’s potential growth rate.
On the fundamental side, our model considers four variables: the trend in real GDP growth (we take a 20-quarter annualized growth rate), the employment to population ratio, core PCE inflation and the nominal fed funds rate.2 The logic for including these latter two variables is as follows: if a given rate of real GDP growth coincides with low inflation, we can infer that growth is near potential and policy is not necessarily accommodative. Conversely, if a given level of real GDP growth is producing inflation pressures, it would imply that policy is set too loosely. As such, it is the constellation of growth, inflation and the policy setting that should simultaneously inform our views on r-star.

To account for other factors that can impact r-star estimates beyond the traditional macroeconomic variables we also include the 10-year term premium. This variable is intended to capture shifts in the supply and demand for savings — not only domestically but also globally – as well as the possible safety premium that could be associated with US assets that could impact estimates of r-star.3 These forces were especially important in capturing the persistently depressed level of r-star that prevailed following the Global Financial Crisis (GFC) even after the economy had largely recovered.

Results: R-star approaching 1%

The proposed model fits the data well over the pre-covid period. All variables are significant and of the expected sign and the r-squared of the regression is more than 90% from 1980 to 2019. More importantly, the model captures the critical dynamics in r-star estimates historically – the structural decline in r-star over time, the fact that it rises somewhat late in the cycle, the collapse in r-star that occurred alongside the GFC, and the fact that r-star estimates remained pinned at record-low levels near zero for much of the decade prior to the pandemic. The fact that this simple model captures each of these facts well provides some confidence that it accounts for the key drivers of r-star, at least prior to the pandemic.
We then extend these estimates beyond Q4 2019 and into the most recent period using the realizations of these variables over the past two and a half years. Two points are worth highlighting. One, model-implied estimates of r-star collapsed with the pandemic as growth plunged, inflation fell, the employment-population ratio dropped, and the term premium compressed. Upon the start of the pandemic, the estimate immediately collapsed to nearly -3%, by far a historical low. Two, the baseline r-star estimates recovered relatively quickly and currently sits around 0.9%.
Figure 1: R-star: macro model versus actual

 width=

Source: FRB NY, Haver Analytics, Deutsche Bank
Figure 2: Contributions to estimated r-star relative to end 2005

 width=

Source: Deutsche Bank
How do these estimates stack up against alternatives? High-frequency estimates of r-star that we produce based on previous Fed research suggest that it could currently be around 1%. A pure market-based measure of 5y5y real OIS yields produces similar estimates around 1%.4 Recent estimates from our colleagues in rates strategy based on the bond-equity correlation over time suggest that r-star could currently be around 1.25%. Finally, the latest estimates from the NY Fed’s macro model (DSGE) currently project r-star near 1.5%.5
Figure 3: R-star estimates now above pre-pandemic, with macro estimates 70-90bps

 width=

Source: FRB NY, Haver Analytics, Bloomberg Finance LP, Deutsche Bank
Figure 4: R-star estimates have generally risen since 2019

 width=

Source: FRB NY, Haver Analytics, Bloomberg Finance LP, Deutsche Bank

Additional considerations for a historically unique period

While the model we have outlined so far has been able to reproduce historical movements in r-star, there is the potential for some unique aspects of the current period to lead to breakdowns between the macro drivers we identify and r-star. For example, in past work we have documented how about 40% of the rise in core PCE inflation is due to supply-side forces. This portion of recent inflation is unrelated to the monetary policy stance and as such r-star could be biased upward if this feature is not considered. If we were to only consider demand-driven inflation in our model, r-star would be about 20bps lower at 70bps.

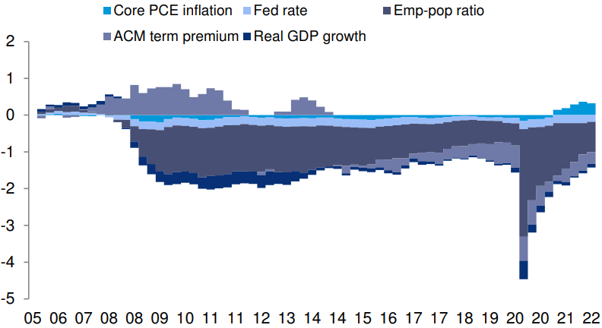
The shift towards a more proactive fiscal stance is likely to have an important impact on r-star estimates over time as well. For example, if a given growth rate could be delivered with easier fiscal policy in exchange for tighter monetary policy, r-star estimates would likely be higher than if that same growth rate were delivered with tighter fiscal policy and easier monetary policy. This substitutability between fiscal and monetary policy instruments is likely one reason why r-star estimates were lower prior to the pandemic and are currently higher post-pandemic. In other words, whether or not the aggressive fiscal policy response to the pandemic marks a structural shift in the proactiveness of fiscal policy could be critical in determining whether r-star can remain at or above recent estimates.

Conclusion

The extreme volatility in macroeconomic data since the pandemic has obscured signals from the economy. Among them is that traditional estimates of r-star based on fundamental economic relationships have proven unusable. In this piece, we present a simple model of r-star that closely tracks all key features of the pre-pandemic HLW estimates. Our approach also allows us to extend HLW r-star estimates through the current period. Based on macro fundamentals we find that r-star estimates are likely in the 70-90bps range. This is modestly above estimates prior to the pandemic, which clustered closer to 50bps. These estimates are close to alternative measures based on surveys, market pricing, the relationship between bonds and equities, and a DSGE model-based estimate from the NY Fed staff. While we should not assume false precision with respect to r-star estimates, it is nonetheless notable that a few approaches suggest the neutral rate has risen relative to before the pandemic. All else equal, these findings argue for a higher terminal rate this cycle than the market is currently pricing and against a near-term pivot in Fed policy.
  • 1.

    See Laubach and Williams (2003), “Measuring the natural rate of interest,” Revised of Economics and Statistics 85, no. 4 (November): 1063-70. Holston, Laubach, and Williams (2017), “Measuring the natural rate of interest: International trends and determinants”, Journal of International Economics 108, supplement 1 (May): S39-S75. 

  • 2.

    A similar approach using a different set of regressors was utilized in an IIF paper earlier this year: Global Macro Views – Remember the thing called R*?. 

  • 3.

    See this work by the NY Fed: “Safety, liquidity, and the natural rate of interest” Del Negro, Giannone, Giannoni and Tambalotti, May 2017. https://www.newyorkfed.org/research/staff_reports/sr812.html

  • 4.

    See, Deutsche Bank US Economic Perspectives, ”(R-)Star gazing: Macro drivers suggest real neutral rate may have risen” 

  • 5.

    See “The NY Fed DSGE Model Forecast – September 2022 ”.  

About the authors

Matthew Luzzetti

Matthew Luzzetti is Chief US Economist and Head of US Economic Research at Deutsche Bank in New York. He was previously an economist in DB’s Office of the Chief Economist in London. Matthew’s research focuses primarily on the US economy and Fed policy. Matthew holds a Ph.D. in Economics from the University of California, Los Angeles.

Brett Ryan

Brett Ryan joined Deutsche Bank’s US Economics Research team in May 2010. Prior to joining the team, Brett spent five years at Deutsche Bank in the institutional equity research sales group. Brett has a Bachelor of Arts degree from the University of Pennsylvania; majoring in politics, philosophy and economics.

Justin Weidner

Justin Weidner is an Economist in Deutsche Bank’s US Economics team in New York. Justin’s research focuses primarily on the US economy and Fed policy, where he regularly contributes to DB’s global economics publications. Justin obtained a Ph.D. in Economics from Princeton University.

Amy Yang

Amy Yang is a Research Analyst in Deutsche Bank’s US Economics team in New York.

More on these topics

Tags: