

This Policy Note is based on the speech by Isabel Schnabel, Member of the Executive Board of the ECB, at The ECB and its Watchers XXIV Conference session on: Geopolitics and Structural Change: Implications for Real Activity, Inflation and Monetary Policy, Frankfurt, 20 March 2024.
Over the past two years, real interest rates in many advanced economies have risen measurably, partly reversing the secular decline since the early 1980s. Two hypotheses can explain these developments. The savings-investment hypothesis argues that structural shifts in savings and investment are driving real interest rates. According to this view, the exceptional investment needs arising from the climate transition, the digital transformation and geopolitical shifts may put upward pressure on r* and hence on real long-term rates. The monetary policy hypothesis argues that central banks themselves may have played a role. The recent rise in real long-term rates may be partly due to financial market participants interpreting the policy tightening and central bank communication as a shift in policymakers’ beliefs about the level of r*, which acts as an anchor for real long-term rates. Given the uncertainty about how central bank actions and communication affect real long-term rates, policymakers need to tread carefully.
Over the past two years, we have seen a measurable and persistent rise in real interest rates across many advanced economies, partly reversing the secular decline that started in the early 1980s.
This increase in real rates has reignited the debate among academics and policymakers about the level of the natural rate of interest, or r*, the real short-term interest rate that would prevail if the economy was operating at its potential and inflation was at target.
The question is whether the recent reversal is a sign that real interest rates will remain higher once the impact of recent shocks has faded, or whether they will return to the lows seen in the pre-pandemic era.
In this note, I will discuss two hypotheses that can help explain the fall and rise in real interest rates.
The savings-investment hypothesis argues that structural determinants of global saving and investment are the ultimate drivers of the natural rate of interest, and hence real long-term rates, which are anchored around r*.
According to this hypothesis, the persistent decline in real long-term rates in the pre-pandemic era was the result of a combination of low investment at times of globally declining productivity growth, high savings due to an ageing population, and a high demand for safe assets in response to global currency and financial crises.
The monetary policy hypothesis argues that monetary policy may have played a role in the persistent downward trend and subsequent rise in real interest rates.
Since r* is a theoretical construct that is unobservable, and the economy’s long-run evolution is surrounded by considerable uncertainty, financial markets often look to the central bank for informing and coordinating their views about real long-term interest rates. By providing long-run guidance, the central bank may influence long-term interest rates.
To the extent that the signal inferred from central banks has an impact on private consumption and investment decisions, it may even result in informational feedback loops, inducing shifts in r*.
The implications of these two hypotheses for the role of monetary policy are quite different. While in the first case, monetary policy merely responds to global structural changes, in the second, it may have long-lasting effects on economic activity.
In the decades following the inflation spikes of the 1970s and early 1980s, we have observed a gradual and persistent decline in real short- and long-term risk-free interest rates globally (Figure 1).
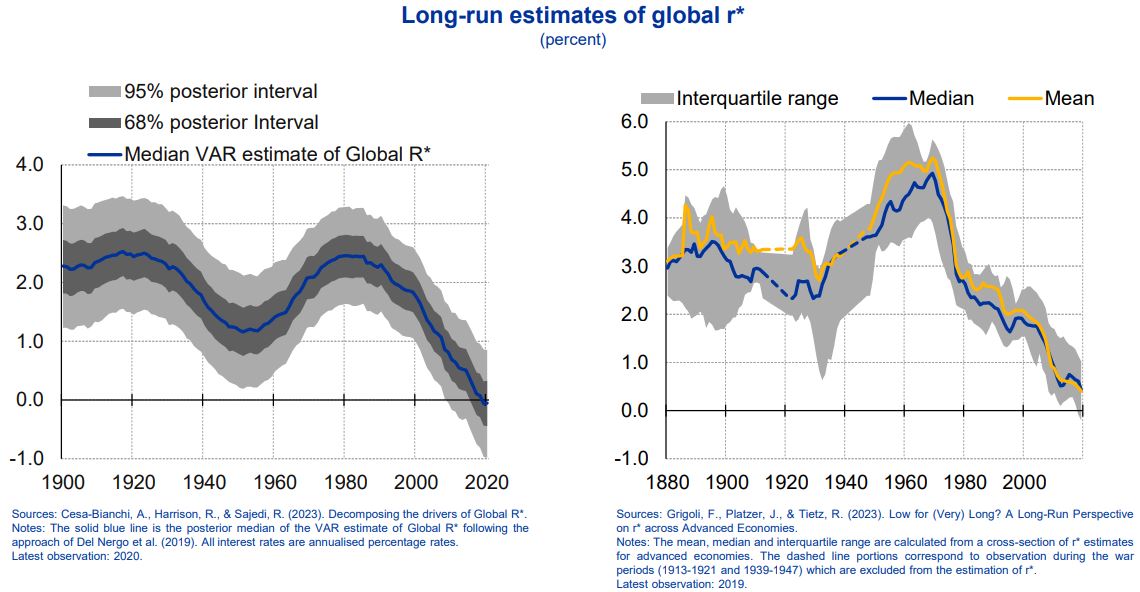
Model estimates show that r*, too, has followed a persistent downward trend over the past decades leading up to the pandemic, even if there is some disagreement about its precise level given high model and estimation uncertainty (Figure 2).1
Figure 1: Real risk-free interest rates declined across advanced economies
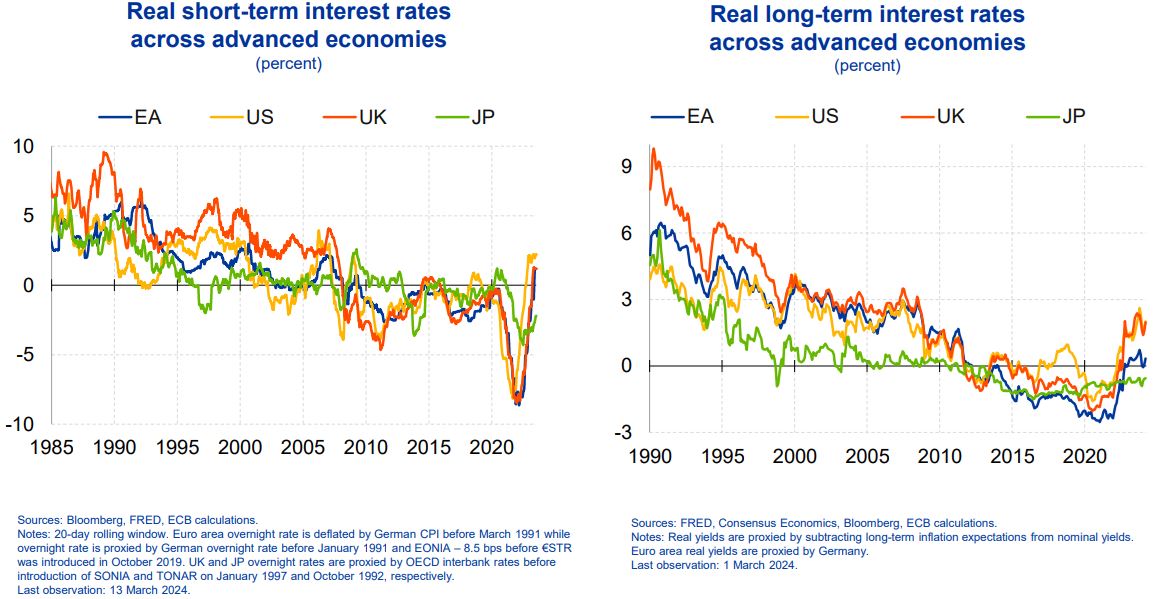
Figure 2: Secular decline in r* across models and countries before the pandemic
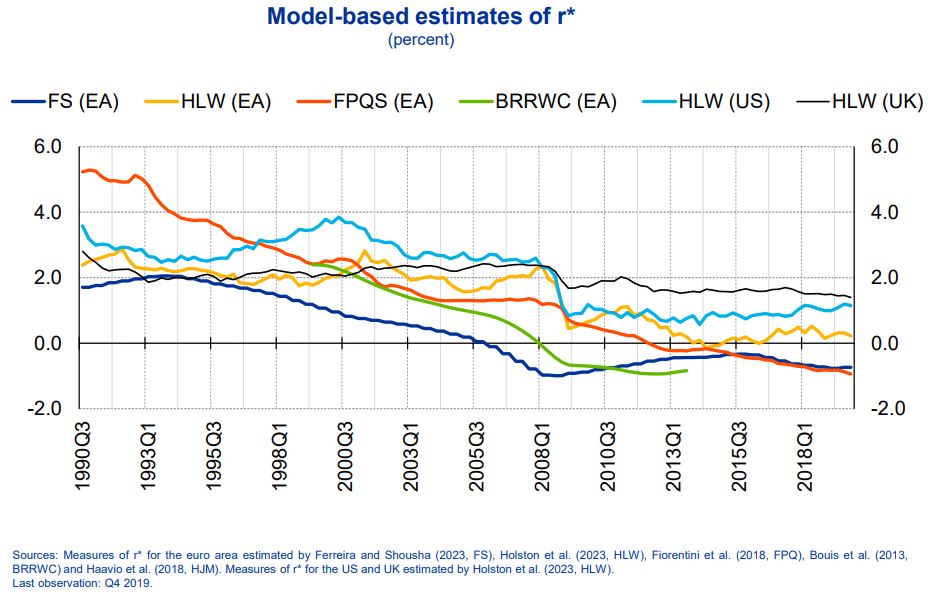
This co-movement is not surprising. If real long-term rates are driven by fundamental forces, then they should align closely with r* over the long run, once the impact of temporary demand or supply shocks has faded and the economy has moved back into equilibrium.2 In other words, r* serves as an anchor for real long-term rates.
Over the past two years, however, this downward trend seems to have reversed. Real long-term yields have increased considerably across advanced economies.
This rise has not just been driven by an increase in spot short-term rates due to the highly synchronised global monetary policy response to the inflation surge. It also reflects a reassessment by market participants of the expected level of real short-term interest rates prevailing in the future.
For example, respondents to the Survey of Monetary Analysts (SMA) expect the ECB’s deposit facility rate (DFR) to level off in a range between 2% and 2.5% over the long run (Figure 3, left-hand side). Given an expected inflation rate of 2% over the same horizon, this would correspond to an r* of 0% to 0.5%. The ECB’s model-based estimates have shown a similar upward trend (Figure 3, right-hand side).3
Figure 3: Survey- and model-based euro area short rate expectations have moved up since 2021
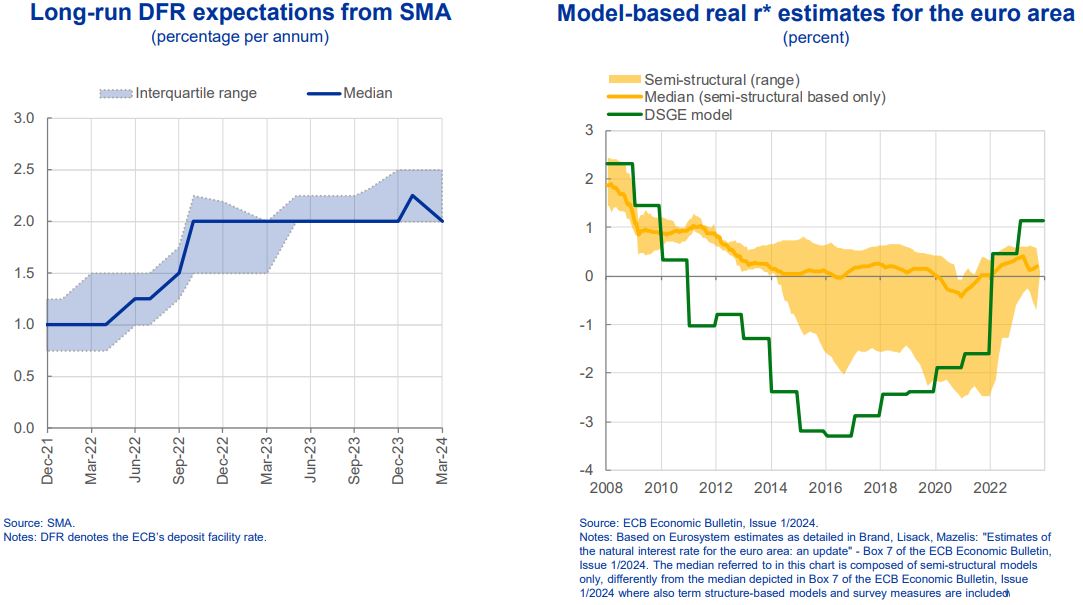
These estimates are around one percentage point higher than before the start of the monetary policy tightening cycle in December 2021, when median survey expectations and model estimates of real short-term rates were in negative territory.
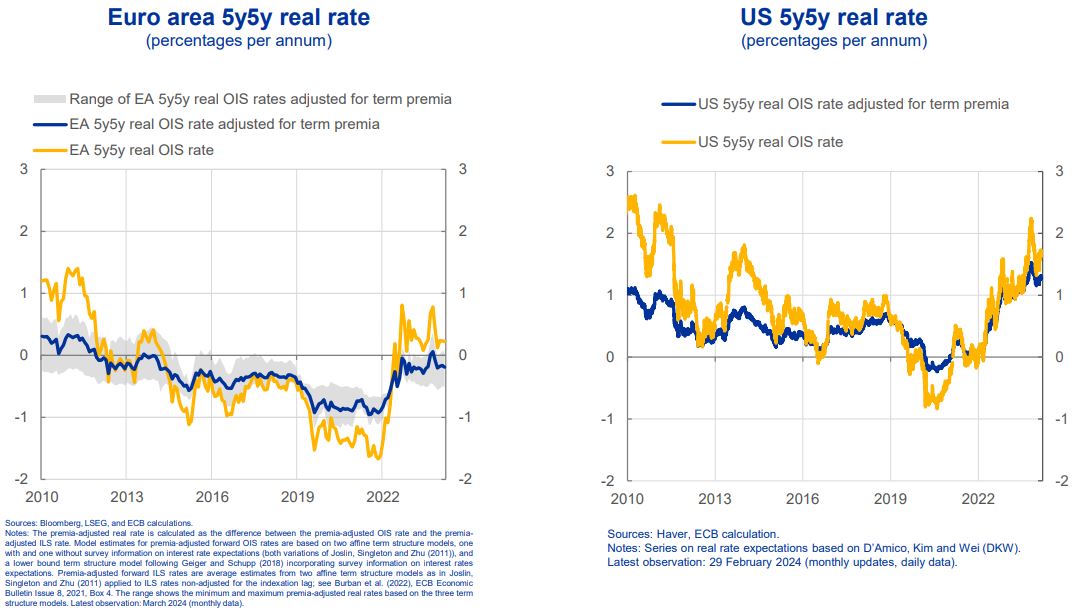
Market-based proxies of r* in the euro area have also increased measurably since late 2021 (Figure 4, left-hand side). The shift is even more pronounced in the United States where market participants price an expected average real short-term rate of above 1% over the long run, substantially higher than in 2021 (Figure 4, right-hand side).
Figure 4: Markets are pricing higher real rates over the long run, especially in the US
So, what factors can help explain these developments in real long-term rates and r*?
One explanation is offered by the savings-investment hypothesis.
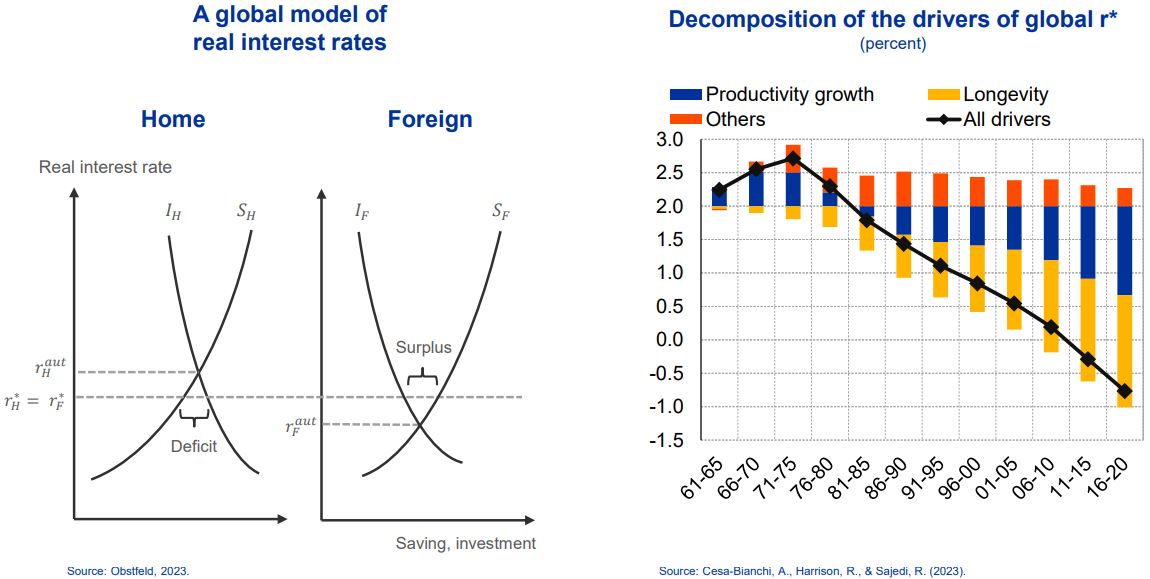
Within a standard macroeconomic framework, changes in equilibrium real interest rates are determined by structural shifts in savings and investments.4 An increase in desired investment, for a given level of desired savings, puts upward pressure on real interest rates (Figure 5, left-hand side).
In a world with free capital flows, real interest rates are determined globally, in line with the remarkable co-movement across major advanced economies.5 Over the long run and without any frictions in financial markets that prevent capital from moving freely across borders, there exists a single equilibrium interest rate that clears the global capital market.6
Global r* thus acts as an anchor for domestic r*.
Figure 5: Decline in global r* mainly due to slowing productivity growth and rising longevity
Proponents of the savings-investment hypothesis have put forward two main factors by way of explaining the fall in r*, and hence real long-term rates, in the pre-pandemic era.
The first is the trend decline in productivity growth, which lowered the marginal return on capital, and thus the demand for investment.7
A second key driver was a persistent rise in savings – what Ben Bernanke called the “global saving glut”.8 Large current account surpluses in emerging market economies with shallow financial markets and a series of currency and financial crises led to a rise in savings, exerting downward pressure on r*.9
Higher risk aversion after the global financial crisis, together with demographic forces, such as a higher life expectancy and longer retirement, further contributed to an increase in desired savings.10
Recent research indeed suggests that the bulk of the decline in global r* since the 1970s can be attributed to slowing productivity growth and rising longevity (Figure 5, right-hand side).11
The savings-investment hypothesis can reconcile the marked divergence in views about the likely persistence of the recent rise in real rates.
To see this, it is useful to think about the natural rate as having two components: a very slow-moving long-run component and a more cyclical component that can drive the natural rate away from its long-run trend over a protracted period.
This is consistent with recent evidence suggesting that real interest rates have oscillated around a persistent downward trend since the start of the Renaissance in the 14th century (Figure 6).12
Figure 6: Historically reversals in interest rate regimes happened at times of major shocks
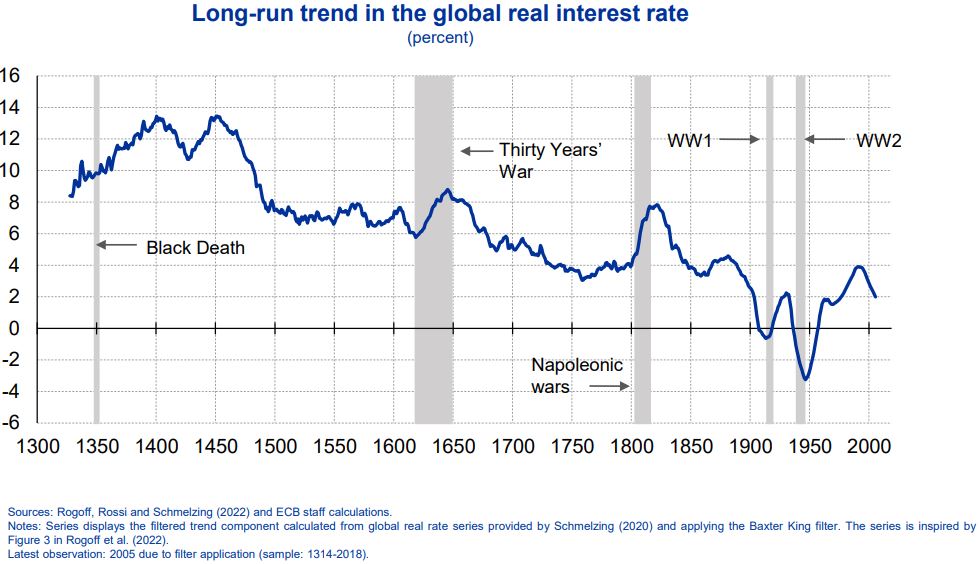
Temporary but protracted reversals in the interest rate regime happened at times of major and persistent structural shocks, such as the Black Death in the 1350s or extended periods of war.
After the Second World War, for example, major investment was needed to reconstruct the European and parts of the global economy, which put upward pressure on r* over several decades until it started to decline in the 1980s (Figure 7).13
Figure 7: Decline in r* followed decades of a persistent rise after WWII
Today, the situation may be similar.
It is possible that the fundamental forces driving our economies in the long run have not changed, despite the series of shocks we have witnessed in recent years.14 As such, an ageing global population and continued subdued productivity growth may remain a drag on real interest rates.
At the same time, overcoming the challenges we are currently facing may ultimately require changes to our economy that are large enough to offset these fundamental forces over the coming years, and possibly beyond.
Specifically, climate change and the green transition, geopolitical shifts due to the Russian invasion of Ukraine and tensions between the United States and China, as well as rapid advances in artificial intelligence and digitalisation will require exceptionally high investment.
The transformation towards a climate- and nature-preserving economy may in itself necessitate investments comparable to what was required to rebuild the European economy after the Second World War.15
According to estimates by the European Commission, annual investment in the energy system in the 2020s needs to be twice as high as in the preceding decade if we want to meet the objectives of the Fit for 55 package.16
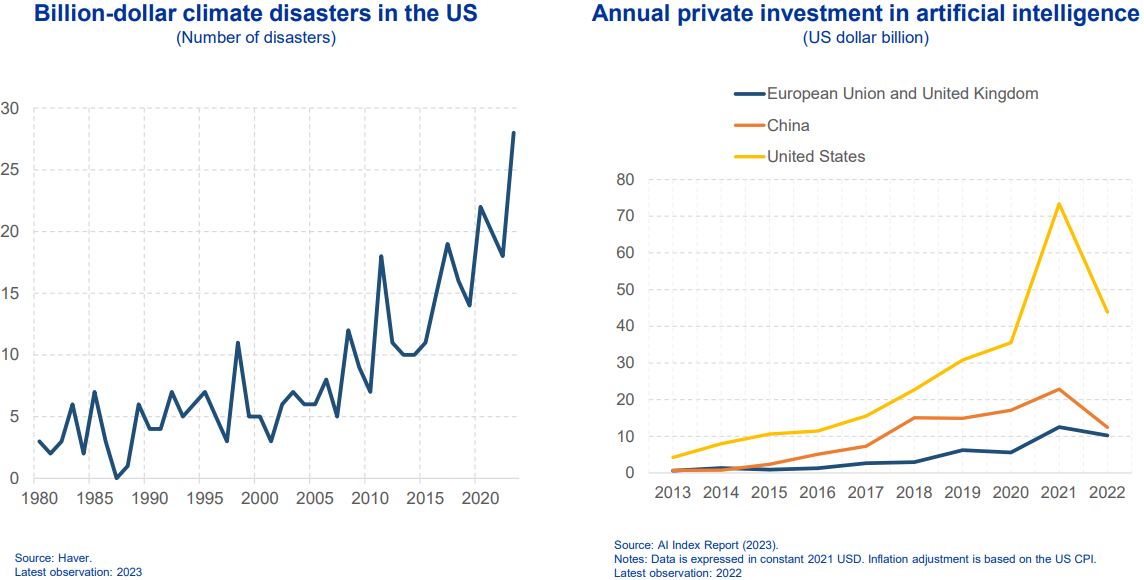
In addition, the higher frequency of extreme weather events is likely to necessitate extensive public and private investments for both rebuilding and adaptation.17 In the United States, the number of billion-dollar disasters has risen exponentially, from just three on average in the 1980s to 28 in 2023 (Figure 8, left-hand side).18
Moreover, benefiting from the rapid advances in artificial intelligence and exploiting the full potential of digitalisation will require large public and private sector investments in physical and human capital for acquiring and implementing new technologies and reshaping business processes.
Such investments will be particularly large in the EU, which has been lagging the United States and China markedly over the past years (Figure 8, right-hand side).19
Figure 8: Climate change and artificial intelligence require exceptionally high investments
Finally, companies that seek to make their supply chains more resilient by diversifying their sourcing strategies will generate another major push towards higher investment.
According to an ECB survey, leading firms operating in the euro area expect to become much more active in near-shoring or friend-shoring operations over the next five years to make their businesses more resilient (Figure 9, left-hand side).
Figure 9: Firms increase resilience of supply chains in response to climate and geopolitical risks
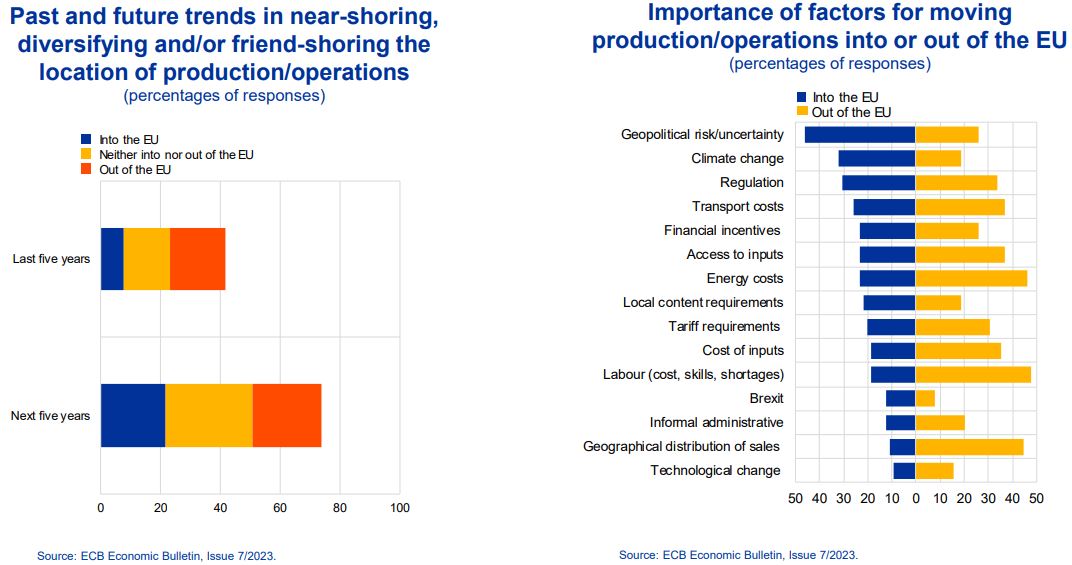
Geopolitical risks and climate change are seen as the two most important factors for relocating production and business operations to the EU. Such relocation could unleash a new wave of capital investment in physical infrastructure (Figure 9, right-hand side).20
Considering that part of these massive overall investment needs will be government-financed, and that, in the new geopolitical situation, defence spending may have to be significantly stepped up, public debt burdens are likely to rise.21 Furthermore, ageing societies may put an additional burden on public budgets.
Higher net issuance, in turn, may face a shrinking supply of global savings, as a gradual retreat in globalisation may reduce current account surpluses.22,23
Overall, therefore, investors’ anticipation of higher private and public investment needs may have put upward pressure on real long-term rates, potentially marking the beginning of yet another protracted period of r* deviating from its long-run trend.24
The second key explanation of the trends of real interest rates suggests that monetary policy itself may play an important role for real long-term interest rates.
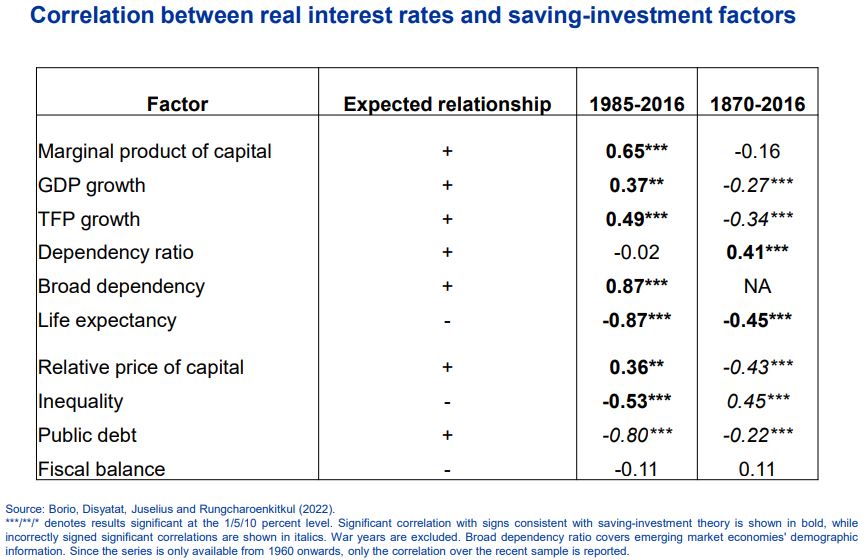
This hypothesis starts from the observation that, despite its theoretical appeal, there has been little evidence of a stable relationship between real interest rates and standard proxies of the key determinants of savings and investment across subsamples over the past 150 years.25
Some key factors, such as demographics or productivity, have the expected relationship with real interest rates in some subsamples but not in others (Figure 10).
Figure 10: No stable relationship between real rates and standard savings-investment determinants
Taking an even longer perspective over several centuries casts more fundamental doubt on the conventional wisdom that the decline in global real rates can primarily be explained by productivity trends: the persistent increase in total factor productivity growth after the Industrial Revolution in the 18th century coincided with a downward trend in real rates.26
The view that monetary policy may help explain these deviations, at least temporarily, is not new. Over the past two decades the literature has studied extensively whether and how monetary policy can have long-lasting effects on real interest rates, going in different directions.27
On the one hand, overly tight monetary policy may lower investment and technological growth.28 On the other hand, persistently expansionary monetary policy may lead to the build-up of financial imbalances and contribute to zombification, reducing potential growth.29
However, the most recent literature has added an interesting twist to the debate, arguing that the most important channel of monetary policy relates to central bank communication.
Recent research documents that the descent in US real long-term yields over the past decades can be explained by very narrow time windows around the Federal Reserve’s monetary policy meetings (Figure 11).30 Outside these time windows, changes to real long-term interest rates have been short-lived.
Figure 11: Decline in US real yields explained by narrow time windows around FOMC meetings
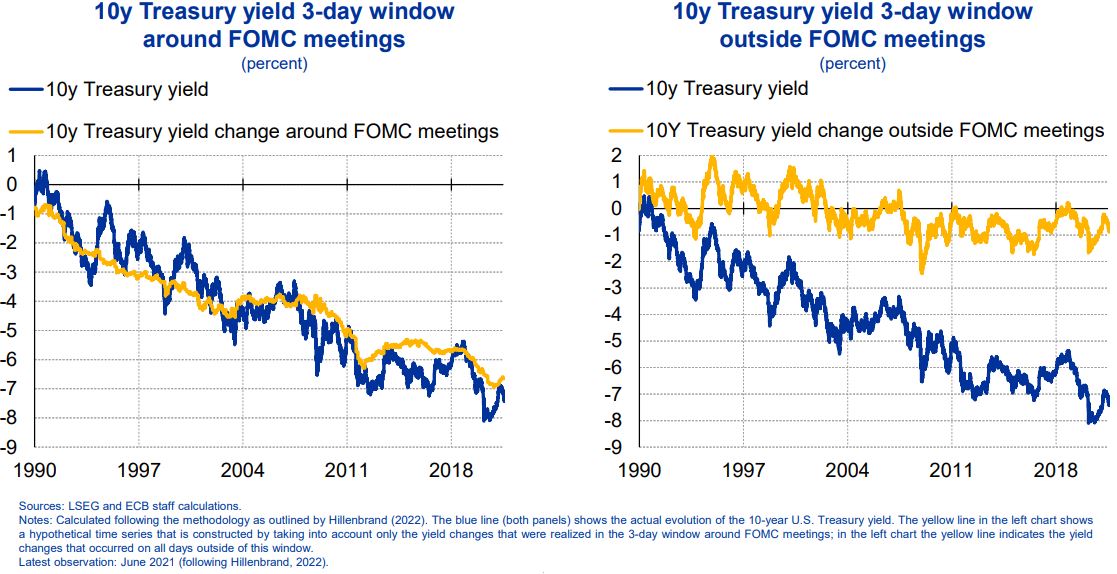
According to this study, long-run forward guidance, as expressed by the dot plots, appears to have lowered real bond yields by around 130 basis points over the last decade.
New research by ECB staff corroborates these findings. It shows that a 100 basis point US monetary policy shock has historically been associated with a 30 basis points increase in r* over the long run.31
As monetary policy is thought to be neutral over the long run, these findings are puzzling. At a deeper level, however, they may not necessarily be at odds with the savings-investment hypothesis.
Even if financial markets may ultimately look to the central bank for information about the long-run evolution of the economy, the thinking behind central bank communication may still be guided by models built on the interactions between savings and investment.
In any case, these studies suggest that the recent rise in real long-term rates may be partly due to financial market participants interpreting the policy tightening, as well as recent central bank communication, as a shift in policymakers’ beliefs about the level of r*.
In other words, the impact of monetary policy actions and communication may be stronger than conventionally assumed.
This would also imply that central banks have little to learn about the natural rate of interest from looking at market pricing, as we may just be looking in the mirror.
Taking this argument further, central banks’ shaping investors’ beliefs about r* may even result in informational feedback loops. For example, easing monetary policy could be seen as signaling a lower r*, inducing firms and households to become less optimistic about the economy.32
This could negatively affect output and inflation insofar as it influences spending decisions. The central bank may then cut rates even further, validating private sector beliefs and weakening the expansionary effects of the policy rate easing.
In this interpretation, the inability of central banks in the pre-pandemic period to bring inflation back to target may partly have been due to self-reinforcing dynamics. If monetary policy easing during that period was interpreted as containing adverse information about the long-run state of the economy, the contractionary effects of the resulting feedback loops may have contributed to persistent declines in r*.
To conclude, protracted reversals in real interest rates have occurred repeatedly in history in the aftermath of large economic, political or social shocks.
We may now be facing such a turning point. The exceptional investment needs arising from structural challenges related to the climate transition, the digital transformation and geopolitical shifts may have a persistent positive impact on the natural rate of interest.
Whether the anticipation of these investment needs has directly been driving real rates higher in recent years, or whether monetary policy has been a catalyst for the repricing, remains subject to discussion.
It is possible, however, that the determined monetary policy response to the inflation burst may have shifted market participants’ beliefs about r*, thereby making a return of secular stagnation less likely.
That said, the uncertainty about how central bank actions and communication affect real long-term rates suggests that policymakers need to tread carefully. Rather than looking to financial markets, which could just be a mirror of ourselves, we need to thoroughly examine whether the fundamental forces driving the economy over the long run have changed, and communicate these views prudently.
Presentation slides (link).
r* estimates are generally constrained so as not to deviate too much from real rates. See Holston, K., T. Laubach and Williams, J.C. (2017), “Measuring the natural rate of interest: International trends and determinants”, Journal of International Economics, Vol. 108, pp. 59–75.
Borio, C. (2021), Navigating by r*: safe or hazardous?”, SUERF Policy Note, Issue 255, 16 September.
The suite of models used is described in Brand, C., Lisack, N. and Mazelis, F. (2024), “Estimates of the natural interest rate for the euro area: an update”, Box 7 of the ECB Economic Bulletin, Issue 1/2024.
Obstfeld, M. (2023), “Natural and Neutral Real Interest Rates: Past and Future”, NBER Working Paper, No 31949, December.
Del Negro, M., Giannone, D., Giannoni, M.P. and Tambalotti, A. (2019), “Global trends in interest rates”, Journal of International Economics, Vol. 118, pp. 248–262.
Cesa-Bianchi, A., Harrison, R. and Sajedi, R. (2022), “Decomposing the drivers of Global R”, Staff Working Paper, No 990, Bank of England, July.
Ferreira and Shousha estimate that an increase in trend productivity growth by 1 percentage point in advanced economies increases r* by 0.62 percentage point. See Ferreira, T.R.T. and Shousha, S. (2023), “Determinants of global neutral interest rates”, Journal of International Economics, Vol. 145(C).
Bernanke, B.S. (2005), “The global saving glut and the U.S. current account deficit”, speech, Board of Governors of the Federal Reserve System (U.S.).
Reis, R. (2023), “The future long-run level of interest rates”, SUERF conference, December.
Caballero, R.J., Farhi, E. and Gourinchas, P.-O. (2017), “The Safe Assets Shortage Conundrum”, Journal of Economic Perspectives, Vol. 31, No 3, pp. 29-46.
Cesa-Bianchi et al., op. cit.
Rogoff, K.S., Rossi, B. and Schmelzing, P. (2022), “Long-Run Trends in Long-Maturity Real Rates 1311-2021”, NBER Working Paper, No 30475.
See Cesa-Bianchi et al., op. cit.; Platzer, J., Grigoli, F. and Tietz, R. (2023), “Low for (Very) Long? A Long-Run Perspective on r* across Advanced Economies”, Working Paper, No 085, International Monetary Fund.
IMF (2023), World Economic Outlook, April; Williams, J. (2023), “Measuring the Natural Rate of Interest: Past, Present, and Future”, speech, Federal Reserve Bank of New York, May.
Kemfert, C., Schäfer, D. and Semmler, W. (2020), “Great Green Transition and Finance,” Intereconomics, Vol. 55, pp. 181-186.
European Commission (2023), Investment needs assessment and funding availabilities to strengthen EU’s Net-Zero technology manufacturing capacity”, Staff Working Document, March. The International Renewable Energy Agency (IRENA) estimates that annual global investment in energy transition technologies must more than quadruple to over USD 5 trillion per year to stay on the 1.5°C pathway, see IRENA (2023), World Energy Transitions Outlook 2023: 1.5°C Pathway, June.
European Catastrophe insurance is a key tool for mitigating losses and precautionary savings. It would tend to lower r*, as it provides funding for reconstruction and, if well-designed, can incentivise risk reduction and adaptation. See ECB (2023), “Policy options to reduce the climate insurance protection gap”, Discussion Paper, April.
Such considerations also demonstrate the difficulty of assessing the overall productivity effects of climate change. On the one hand, innovations and investments induced by transition policies have a positive impact on productivity, at least over the longer term. On the other hand, productivity can be lower due to higher energy prices in the transition period as well as increasing climate-related damages, which reduce growth and raise precautionary savings. See also Mongelli, F. P., Pointner, W. and van den End, J. W. (2022). “The effects of climate change on the natural rate of interest: a critical survey“, Working Paper Series, No 2744, ECB.
Schnabel, I. (2024), “From laggard to leader? Closing the euro area’s technology gap”, inaugural lecture of the EMU Lab at the European University Institute, Florence, 16 February.
ECB (2023), “Global production and supply chain risks: insights from a survey of leading companies”, Economic Bulletin, Issue 7.
Estimates of the ratio of public to private investment in the green transition range from around 20% to 45%. Darvas, Z. and Wolff, G. (2021) “A green fiscal pact: climate investment in times of budget consolidation”, Policy Contribution, No 18, Bruegel; EIB (2021), EIB Investment Report 2020/2021: Building a smart and green Europe in the Covid-19 era.
In addition, a more forceful macroprudential framework lowering financial and macroeconomic volatility may contribute to a lower demand for safe assets. For further details on these financial stability channels see Van der Ghote, A. (2021), “Benefits of macroprudential policy in low interest rate environments”, Research Bulletin, No 90, ECB.
Moreover, demographic trends may lower the provision of savings if members of the baby boomer generation dissave on a sufficiently rapid scale when they retire. See Goodhart, C. and Pradhan, M. (2020), “The Great Demographic Reversal,” Economic Affairs, Wiley Blackwell, Vol. 40, No 3, pp. 436-445.
Blanchard refers to “back-of-the-envelope computations” whereby a 1 percentage point increase in the debt-to-GDP ratio raises r* by 2 to 4 basis points. Blanchard, O. (2023). Fiscal Policy Under Low Interest Rates, MIT Press, Cambridge.
Borio, C., Disyatat, P., Juselius, M. and Rungcharoenkitkul, P. (2022), “Why So Low for So Long? A Long-Term View of Real Interest Rates”, International Journal of Central Banking, Vol. 18, No 3, pp. 47-87, September.
For estimates of the evolution of productivity in England from 1250 to 1870 see Bouscasse, P., Nakamura, E. and Steinsson, J. (2023), “When Did Growth Begin? New Estimates of Productivity Growth in England from 1250 to 1870”, Cambridge Working Papers in Economics 2323, Faculty of Economics, University of Cambridge.
BIS (2024), “Quo vadis, r*? The natural rate of interest after the pandemic”, Quarterly Review, March.
Elfsbacka Schmöller, M., Spitzer, M. (2022). “Lower for longer under endogenous technology growth”, Working Paper Series, No 2714; Ma, Y. and Zimmermann, K. (2023), “Monetary Policy and Innovation,” NBER Working Papers, No 31698, National Bureau of Economic Research.
Mian, A., Straub, L. and Sufi, A. (2021): “Indebted demand”, Quarterly Journal of Economics, Vol. 136, No 4, pp 2243–307; Banerjee, R. and Hofmann, B. (2022), “Corporate zombies: anatomy and life cycle,” Economic Policy, 37(112), pp. 757-803.
Hillenbrand, S. (2023), “The Fed and the Secular Decline in Interest Rates” Working Paper, Harvard Business School, March.
Leiva-León, D., Uzeda, L. and Sekkel, R. (2023). “Do monetary policy shocks affect the neutral rate of interest?”, mimeo. A similar conclusion, namely that a 100 basis point monetary policy shock is associated with a 42 basis point increase in US forward real rates in the distant future, is found in Hanson, S. and Stein, J.C. (2015), “Monetary Policy and long-term real rates”, Journal of Financial Economics, 115, pp. 429-448.
Rungcharoenkitkul, P. and Winkler, F. (2022) “The Natural Rate of Interest Through a Hall of Mirrors,” Finance and Economics Discussion Series 2022-010, Board of Governors of the Federal Reserve System.