The use of Machine Learning (ML) models is gaining traction in finance due to their better predictive capacity compared to traditional statistical techniques (see a survey by Königstorfer and Thalmann 2020). One of the use cases with greater potential is its application to credit underwriting and scoring, since by having better predictive capacity, ML models allow better estimates of the probability of default and therefore could result in more accurate credit scores. But this improvement in predictive performance does not come without risk. ML models can potentially be much more complex than traditional econometric ones, and this implies new challenges for both users and supervisors in terms of new model risk factors like biases, data quality, dependencies on third-party providers, etc. (Dupont et al. 2020). Importantly, one of the main challenges for using ML in credit scoring is the interpretability of the outcome of the models. While traditional statistical techniques are inherently interpretable and therefore easy to explain their results through reasoning, interpreting the prediction of complex ML models could be a much more difficult task. This is why in recent years a field of study is flourishing in data science which brings together different methods and processes capable of explaining the influence of the explanatory variables on the outcome of ML models. One of the most valuable tools in this field are the post hoc interpretability techniques, or model agnostic techniques, which can be applied to any model after its training. While they can represent a valuable help for the challenge of interpretability in the use of ML models for credit decisions, there are currently doubts about their reliability (e.g.: Rudin 2019).
How reliable are these interpretability techniques? In this article we propose to generate our own datasets in order to answer this question. We generate datasets following an approach that allows us to control the importance of each explanatory variable (feature) in our target variable (a binary variable representing default of applicants)1. By defining the importance of features ourselves, we can then calculate to what extent the explanations given by the interpretability techniques match the underlying truth. Therefore, if in our generated dataset we define a feature as relevant to the target variable, the interpretability technique should also identify it as an important feature.
Different to other approaches, we test the reliability of interpretability techniques by assessing the accuracy of their explanations, while other studies try to measure their stability (Visani et al. 2020), or adapt these techniques to account for realistic assumptions like correlated features (Aas et al. 2021), or grouping features (Miroshnikov et al. 2021).
The importance of synthetic datasets is increasing in finance2. For example, data privacy regulation typically requires anonymization in credit environments to address sensitive data characteristics. Since the risk of re-identification is important, researchers often turn to generative models such as Generative Adversarial Networks (GANs) for its acronym in English, to generate new instances of data that have similar statistical properties to the original dataset. With this new simulated data, institutions can train and test their ML models without violating any data protection regulations. They can also share this data with third parties, which could stimulate collaboration.
However, since we need to know the true relationship between variables in the dataset to check if an explanation given by an interpretability technique is correct, using generative models like GANs to replicate existing data is not helpful to us. Therefore, we need to generate datasets from scratch, determining the importance of each feature for the target variable, that is, defining the underlying truth of the simulated data. In this way, we define ex-ante which variables are relevant and which are not, and thus we can later check if the explanations of the ML models are in line with our definition of the data.
Despite the existence of a new and growing literature on the use of synthetic data for ML interpretability, there is not a standardized procedure on how to create these synthetic datasets. Thus, for the purposes of our article, we will take no assumption or knowledge on the data we wish to create, this way we can be as flexible as possible. With our methodology we can choose, for each dataset, the number of observations, the number of features, the percentage of positives in the binary target variable and the correlation structure, taking into account the typical characteristics of a credit dataset.
Our framework has four steps:
We generate datasets intended to resemble credit rating datasets. For each generated dataset, we start selecting the number of loans, the percentage of 0 and 1 in the target variable (default of applicants), and the number of features. We select values for these variables to be as close as possible to the values observed in most consumer credit datasets (for example, the target variable, default, is a binary variable with a mean between 0.03 and 0.073). We draw the features from a multivariate normal distribution with a given correlation structure. Then, we determine the importance of each feature for the target. Finally, we transform some of the normal variables to other distributions (Beta, Gamma, categorical, etc.).
We transform the distribution of the features to determine their importance in the target variable. We first select their overlap. This is a parameter that takes values between zero and one, and refers to the amount of separation between positives and negatives in the target variable conditional on the distribution of a given feature. If a feature has overlap one, it means that its distribution associated with default overlaps completely with its distribution associated with non-default, and it has no discriminatory power. On the other hand, if a feature has an overlap of zero, then its importance on the target variable is maximum. Once we have applied the desired degree of overlap, a percentage of values of the feature will have a random noise created (noise), a percentage of elements will change its position without taking into account the target values (corruption), and a percentage of values will be replaced by empty or null value (sparsity).
The less overlap, corruption, noise and sparsity, the more important the feature. Therefore, in order to create the ranking, since all four characteristics are values between zero and one, for each feature we sum the four characteristics, and we order the features in descending order. The possible range for overlap, noise, corruption and sparsity is such that the resulting dataset has on average similar correlation structure to those of the typical credit dataset.
In each of our generated datasets, there exists a binary target variable (Default) and a set of features with different importance for it. We use two (non-interpretable) ML models, XGBoost and Deep Learning, to predict the default of applicants. We use these two ML models because they are among the most relevant in credit default prediction (Alonso and Carbo 2022a). In each of the datasets the data is split into three samples, train (60%), validation (20%), and test (20%).
For each of the generated datasets, we have trained a non-interpretable ML model, obtaining a set of predictions from each ML model. Which are the features that are more relevant for the predictions? We apply two of the most important post-hoc global interpretability techniques: SHAP and Feature Importance (FI). Both techniques can rank features from most important to least important, and could be applied to any ML model after it has been trained. These techniques rely on permutation of the values of the features or creating coalition of features to check which features contribute more to the final value of the prediction (SHAP), or which features contribute more to the error of a given metric (FI). We select these two techniques because they are the most widespread used in academia and industry (FinRegLab, 2022). Out of scope of the paper is to analyze their weaknesses or strengths. For a complete review of these and other interpretability techniques, see Molnar (2020).
How do we determine the accuracy of post hoc explanations? We know the ordered ranking of importance because we have created the dataset. And we can compute the ordered ranking from both SHAP and Feature Importance. In order to compare the real ordered ranking with the one from the post hoc interpretability techniques, we need a quantitative metric. Two of the most used metrics to compare rankings are Kendal Tau and Ranked Based Overlap (RBO). We will use RBO since Kendall Tau has some serious drawbacks, like the fact the it needs the ranking list to be conjoint, and it is unweighted, meaning that disagreements in the top of the ranking are as important as disagreements at the bottom of the ranking. In addition to comparing the order of the actual ranking with the order of the rankings obtained with SHAP and Feature Importance, we can compare the magnitude of the importance given to the features.
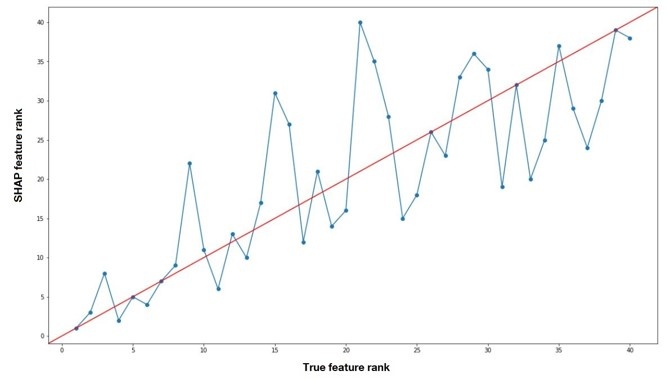
As an empirical example, we create a dataset with 40 variables, and 100,000 observations, with 3% of default, with average correlation of 0.1, and with correlation among 10 most important variables of 0.4. We train a XGBoost using 80,000 observations, and make 20,000 predictions (test sample). The AUC-ROC of XGBoost is 0.95, which indicates that XGBoost is doing a good job at predicting the binary target. We then apply SHAP to the 20,000 predictions of XGBoost. SHAP will deliver a ranking, from most important to least important, computing the average impact on the ML output of each feature. We can then compare how similar that ranking is to the real ranking, made by ourselves, adding parameters overlap, noise, corruption and sparsity.
In figure 1 we show graphically the comparison. On the x-axis we represent the real ranking, and on the vertical axis, the SHAP ranking after applying XGBoost. If the points on the scatterplot are on the 45-degree line that means that the feature is ranked in the same way in both the real ranking and the SHAP ranking. It can be seen that the points do not necessarily fall on the 45-degrees’ line. While the first feature of the real ranking is correctly identified as the most important feature by the SHAP ranking, the second and third features of the real ranking are identified as the 3rd and 8th in the SHAP ranking. Mismatches are to be expected, as we are putting explainability techniques to a severe test. In any case, it can be seen that as we go through the real ranking, the SHAP ranking follows closely, and the points are near the 45-degree line. We note that despite the mismatches, the order of SHAP is in line with the order of the real ranking.
Figure 1
In the paper Alonso and Carbo (2022b), we create 250 simulated datasets and assess how similar are rankings provided by SHAP and FI to the real rankings with different metrics, assessing how results depend on the original ML model performance, in presence of more correlation, etc.
The use of ML in finance is gaining momentum, but it is not exempt from risks. Among them, one of the most important is the interpretability of the results, which is particularly relevant in the field of credit scoring. Different interpretability techniques are being created to help interpret the results of ML models. But this is still an incipient area, and there is no consensus about their reliability, nor about how they should be evaluated. In this article we tackle this concern by generating our own datasets. The use of generated datasets allows us to define the importance of the variables, and therefore we can assess if the explanation given by the interpretability techniques is in line with the nature of the data we created. From our empirical exercise, we observe that the accuracy of SHAP is better than permutation FI, particularly for XGBoost. In any case, the accuracy of both methods is reasonably high, considering the difficulty of the task at hand. We acknowledge that this methodology must be adapted to generate contexts other than those created in this article, such as situations where the correlation between variables is very high. We conclude that using synthetic datasets seems like a promising research area for authorities to work on, as it can be an extremely useful tool to ease the use of innovative ML models while mitigating the risks that are created.
Aas, K., Jullum, M., & Løland, A. (2021). Explaining individual predictions when features are dependent: More accurate approximations to Shapley values. Artificial Intelligence, 298, 103502.
Alonso, A., & Carbó, J. M. (2022a). Measuring the model risk-adjusted performance of machine learning algorithms in credit default prediction. Financial Innovation, 8(1), 1-35.
Alonso, A., & Carbó, J. M. (2022b). Accuracy of explanations of machine learning models for credit decisions. Documentos de Trabajo/Banco de España, 2222.
Dupont, L., Fliche, O., & Yang, S. (2020). Governance of artificial intelligence in finance. ACPR-Banque de France Discussion Document.
Königstorfer, F., & Thalmann, S. (2020). Applications of Artificial Intelligence in commercial banks–A research agenda for behavioral finance. Journal of Behavioral and Experimental Finance, 27, 100352.
Miroshnikov, A., Kotsiopoulos, K., & Kannan, A. R. (2021). Mutual information-based group explainers with coalition structure for machine learning model explanations. arXiv preprint arXiv:2102.10878.
Molnar, C. (2020). Interpretable machine learning. Lulu. com.
Rudin, C. (2019). Stop explaining black box machine learning models for high stakes decisions and use interpretable models instead. Nature Machine Intelligence, 1(5), 206-215.
FinRegLab (2022). Machine Learning Explainability & Fairness: Insights from Consumer Lending.
Visani, G., Bagli, E., Chesani, F., Poluzzi, A., & Capuzzo, D. (2020). Statistical stability indices for LIME: obtaining reliable explanations for Machine Learning models. arXiv preprint arXiv:2001.11757.