High levels of uncertainty can have a serious negative impact on key macroeconomic variables. Policy makers therefore call for indicators of economic uncertainty. Sovereign credit default swap (CDS) contracts provide protection against losses from defaults on government debt. Such contracts are traded for almost all countries by the world’s largest financial institutions. The volatility of sovereign CDS spreads should therefore reflect uncertainty regarding these institutions’ assessments about the economic conditions in a country. We find that sovereign CDS volatility shares directional information with popular economic policy uncertainty (EPU) indices and yields similar responses to uncertainty shocks. Sovereign CDS volatility could therefore be used either as a supplementary uncertainty indicator, or as a general indicator of economic uncertainty for countries where EPU is unavailable and other indicators are unreliable or difficult to obtain.
High levels of economic uncertainty can have serious negative effects on financial markets and real economic activity. Companies postpone recruitment and investment, durable consumer goods sales decline, and financial markets become more volatile. These effects are now well documented (Bloom 2009, Bachmann et. al. 2013, Baker et. al. 2016) and we have already seen sharply declining private consumption and volatile financial markets in the ongoing COVID-19 pandemic – a period of extreme economic uncertainty. It should come as no surprise, then, that policy makers and economic analysts are calling for meaningful indicators of economic uncertainty. But economic uncertainty is a fuzzy concept. Uncertainty depends on knowledge and views about the future, and both can vary widely among economic agents. Thus, there is no single “true” measure of economic uncertainty. Rather, economic uncertainty can be measured from different angles.
Survey-based indicators of economic uncertainty capture disagreement among professional forecasters about future values of important macroeconomic variables. News-based indicators look at the prevalence of words that reflect economic uncertainty in newspaper articles. Statistical indicators of economic uncertainty extract information from important economic time series. All three types of indicators are useful, but they are very data intensive to construct and often only available for a few economies.
Against this background, we empirically examine whether the volatility of sovereign credit default swap (CDS) spreads provide information about economic uncertainty. Sovereign CDS contracts offer protection against losses from defaults on government debt. The periodic premium for protection is the CDS “spread”, and this spread ultimately depends on a country’s financial health. Moreover, sovereign CDS contracts are mainly traded by global financial institutions. In fact, the most active traders in the CDS market are so-called G16 traders – the world’s largest banks in the derivatives business. Sovereign CDS spread volatility should therefore reflect uncertainty regarding these institutions’ assessments about the economic conditions in a country, which provides another potentially complementary angle to gauge uncertainty. We refer to this as an “outside view” on economic uncertainty.
A widely used measure of economic uncertainty is the economic policy uncertainty (EPU) index of Baker et.al. (2016). This index measures the intensity of newspaper coverage of political and economic uncertainty in a country. As we have noted above, CDS volatility measures potentially another dimension of uncertainty. Nevertheless, the directional movements of both indicators should tend to coincide to some extent. We therefore ask whether EPU indices and sovereign CDS volatility contain overlapping information about country-specific economic uncertainty?
EPU indices are currently only available for selected economies. We can compare EPU and CDS volatility over the period October 2008 – December 2020 for the following countries: euro area countries (France, Germany, Ireland, Italy, Netherlands, Spain), major advanced economies (Canada, Great Britain, Japan, South Korea, Sweden, USA), and emerging market economies (Brazil, Croatia, Mexico, Russia).
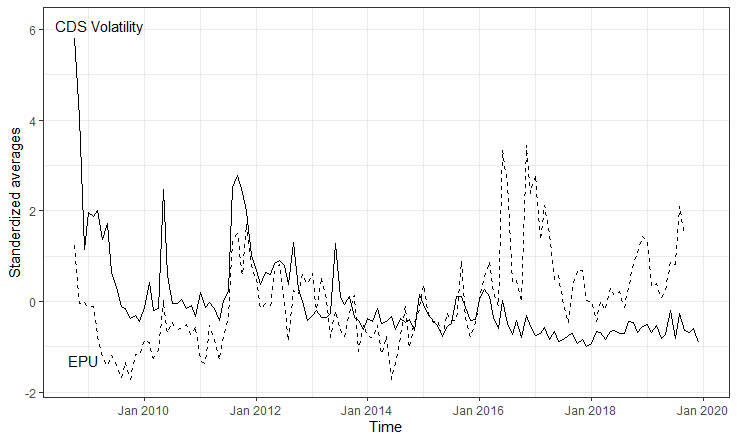
Figure 1 shows how standardized CDS volatility and EPU, averaged over all countries in the sample, evolved over time. Both series show similarities. They peak in 2008 because of the financial crisis and in 2010 and 2012 because of the euro area sovereign debt crisis. However, the level of EPU indices and CDS volatility are not directly comparable. The reason for this is that EPU indices are dimensionless and are normalized to an average level of one hundred whereas CDS volatility is measured in basis points. Thus, we cannot directly compare the levels of EPU indices and CDS volatility, but we can examine whether EPU and CDS volatility are pointing in the same direction.
Figure 1: Standardized cross-sectional averages of EPU and sovereign CDS volatility.
We compare the agreement between directional movements in sovereign CDS volatility and the corresponding EPU country index in four dimensions. We compute overall accuracy (AC) which is the proportion of agreements between CDS volatility and EPU, the hit rate (HR) which is the proportion of simultaneous up movements in EPU and CDS volatility, the false alarm rate (F) which is the proportion of up movements in CDS volatility when the EPU index goes down, and the Kuiper score (KS) which ranges from -100 (total disagreement) to 100 (complete agreement) and measures how well directional movements in sovereign CDS volatility and the corresponding EPU country index agree over time.
Figure 2: Agreement between directional movements in sovereign CDS volatility and EPU indices.
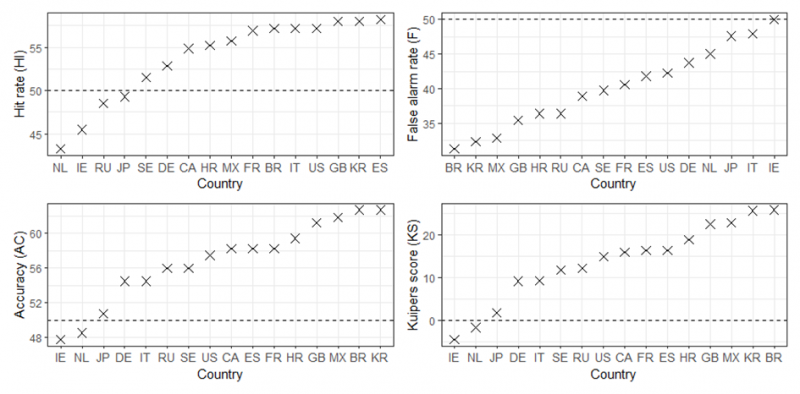
Figure 2 summarizes our findings. As can be seen, directional movements in sovereign CDS volatility and the EPU index do not agree very well in some cases (Netherlands, Ireland, Russia, Japan), but in most cases the directional movements in both indicators show some commonality. Hit rates and accuracy are usually well above 50%, false alarm rates are always below 50%, and the Kuiper score is typically between 10 and 25. Regression based statistical test also support the above findings. In sum, sovereign CDS volatility and EPU indices agree to some extent on the direction of county specific economic uncertainty.
The usual way to assess the impact of economic uncertainty on key macroeconomic variables is to estimate a vector autoregressive (VAR) model and to compute the responses of the macroeconomic variables to a shock in economic uncertainty.
Figure 3: Response of output to uncertainty shocks.
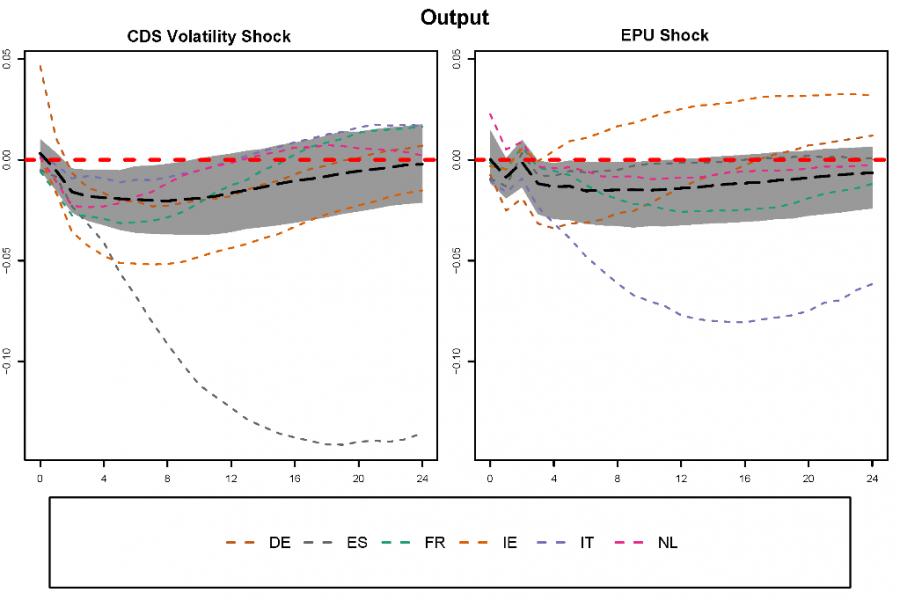
How do such responses look like for euro area countries, for instance? Figures 3 and 4 show the estimated responses of output for France, Germany, Ireland, Italy, Netherlands, and Spain when uncertainty is measured by sovereign CDS volatility and by an EPU country index, respectively. The estimates are from a Bayesian panel VAR model that also provides estimates of a common mean response for the countries. In these figures the colored dashed lines are the country-specific responses to an uncertainty shock, and the dashed black line shows the common mean response together with 68% credible intervals.
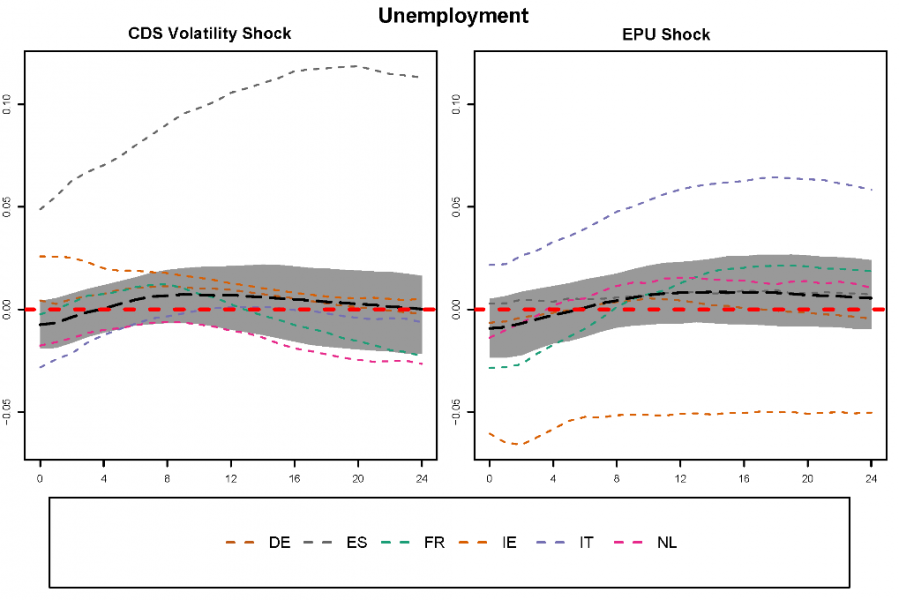
The adverse effects of economic uncertainty are easy to see. Output declines and unemployment rises after an uncertainty shock, no matter whether uncertainty is measured by CDS volatility or by an EPU index. The macroeconomic responses are similar for both indicators. The same is true for our major advanced economies and emerging market economies. Shocks to sovereign CDS volatility and EPU indices yield similar macroeconomic responses in VAR models.
Figure 4: Response of unemployment to uncertainty shocks.
As we have already said, no single true measure of economic uncertainty exists. Hence, we are not claiming that sovereign CDS volatility is a “better” indicator economic uncertainty than others. But sovereign CDS volatility might be a valuable indicator of economic uncertainty for at least three reasons. First, sovereign CDS volatility provides information about country-specific economic uncertainty from the viewpoint of the largest financial institutions worldwide. As such, it is a complementary indicator of economic uncertainty. Second, daily CDS quotes for almost all countries are readily available in all popular economic databases. Moreover, CDS volatility is easy to compute, and CDS volatility can be directly compared across countries. Third, sovereign CDS volatility shares directional information with EPU indices and yields similar responses to uncertainty shocks. Sovereign CDS volatility could therefore be used either as a supplementary uncertainty indicator, or as a general indicator of economic uncertainty for countries where EPU is unavailable and other indicators are unreliable or difficult to obtain.
Bachmann, R., Elstner, S., Sims, E. R. 2013. Uncertainty and Economic Activity: Evidence from Business Survey Data. American Economic Journal: Macroeconomics 5 (2), 217 – 249.
Baker, S. R., Bloom, N., Davis, S. J., 2016. Measuring economic policy uncertainty. The Quarterly Journal of Economics 131 (4), 1593–1636.
Bloom, N. 2009. The Impact of Uncertainty Shocks. Econometrica 77 (3), 623 – 685.
Böck, M., Feldkircher, M., Raunig, B., 2021. A View from Outside: Sovereign CDS Volatility as an Indicator of Economic Uncertainty, OeNB Working Paper 233.
Available at: https://www.oenb.at/Publikationen/Volkswirtschaft/Working-Papers.html