menu
close

Author(s):

Arthur Stalla-Bourdillon | Banque de France

Keywords:

out-of-sample return predictability , efficient market hypothesis , conditional beta pricing model , alpha predictability

JEL Codes:

C22 , C53 , G12 , G14 , G17

Economic theory identifies two potential sources of return predictability: time variation in expected returns (beta-predictability) or market inefficiencies (alpha-predictability). For the latter, Samuelson argued that macro-returns exhibit more inefficiencies than micro-returns, as individual stories are averaged out, leaving only harder-to-eliminate macro-mispricing at the index-level. To evaluate this claim, we compare macro- and micro-predictability on US data to gauge if the former turns out higher than the latter. Additionally, we extend over time the methodology of Rapach et al. (2011) to disentangle the two sources of predictability. We first find that Samuelson’s view appears incorrect, as micro-predictability is not structurally lower than macro-predictability. Second, we find that our estimated alpha- and beta-predictability indices are coherent with their corresponding theoretical implications, thus suggesting that the two mechanisms are at play in our dataset.

Theoretical sources of stock return predictability

Are macro-stock returns easier to predict than micro-returns? In other words, can we forecast more precisely next-period returns at the index-level compared to the sector- or to the firm-level (especially considering the low level of predictability usually found in the literature)?

To guide our analysis, Samuelson had the intuition that macro-returns exhibited more inefficiencies than micro-returns (Jung and Shiller, 2005). His reasoning was that individual efficient stories (for example linked with firms’ future profitability) were averaged out in the aggregate, leaving only harder-to-eliminate macro-mispricing at the index-level. As a consequence, if return predictability stems from market inefficiencies, for example from speculative bubbles or from financial frictions, then we should observe higher predictability at the macro-level compared to the micro-level.

However, the interpretation of return predictability is sensitive. High level of predictability can indeed reflect market inefficiencies, what people called the “alpha-predictability”, but it can also mirror variations in aggregate risk aversion, also framed as the “beta-predictability”. More precisely, Cochrane (2008) argues that, as investors’ risk aversion varies over time, expected returns vary as well. Taking into account time variation in expected returns along the business cycle can therefore generate return predictability even in the absence of market inefficiencies. To put it bluntly, in the midst of an economic crisis, investors become highly risk averse. This leads to a decline in stock prices and to an increase in expected returns. People could therefore predict that returns will be high in the future, but they are too concerned about their current situation to benefit from it.

Our methodology to gauge return predictability

To evaluate these different claims, we compare, over time and with the use of various forecasting models, macro- and micro-predictability on US data to gauge if the former turns out higher than the latter. In this first step we are only estimating the “raw” predictability on the equity markets, that is our mere ability to predict, in pseudo-real time, future stock returns. Micro-predictability is evaluated on the returns of the 25 Fama-French portfolios sorted by size and by book-to-market ratio, while macro-predictability reflects our ability to forecast the returns of the overall US market.

In a second step, we extend over time the methodology of Rapach et al. (2011) to disentangle these raw micro- and macro-predictability series into the two sources of predictability mentioned above (the alpha- and the beta-stories). Again, our alpha-predictability metrics are supposed to reflect stock market inefficiencies, while our beta-predictability estimates should coincide with changes in investors’ risk aversion (such as during recessions, Henkel et al., 2011).

Results: raw micro-predictability is not lower than macro-predictability

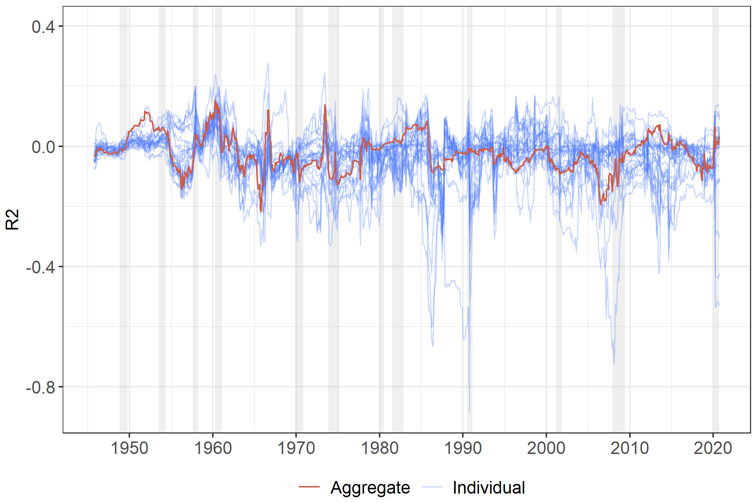
We first find, as indicated on the Graph 1 below, that Samuelson’s view appears incorrect, since raw micro-predictability (in blue) is not structurally lower than macro-predictability (in red). On the reverse, it appears that micro-predictability exhibits only a higher variance but not a lower mean than the macro-predictability series. Second, pooling the different raw micro-predictability series yields an index that is very close to the macro-predictability estimate, suggesting thus that some diversification effects are indeed at play in our dataset.

Graph 1: Micro- and Macro-Raw Predictability series, over time
 width=

Note: On the graph are represented the macro- (in red) and micro- (in blue) raw predictability indices. Micro-predictability is estimated at the sectoral level. The metric used is the out-of-sample R2 that can take negative values. The grey vertical bands figure the NBER US recession dates.

Results: alpha- and beta-predictability appear to play a role

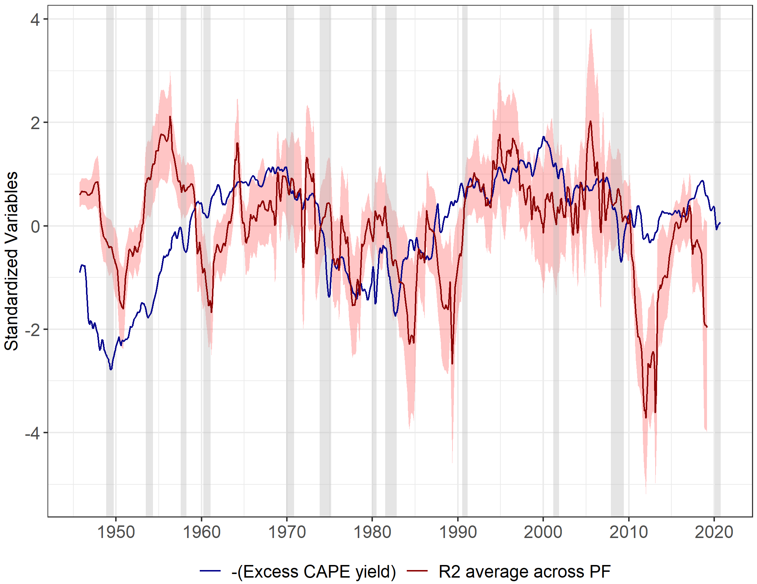
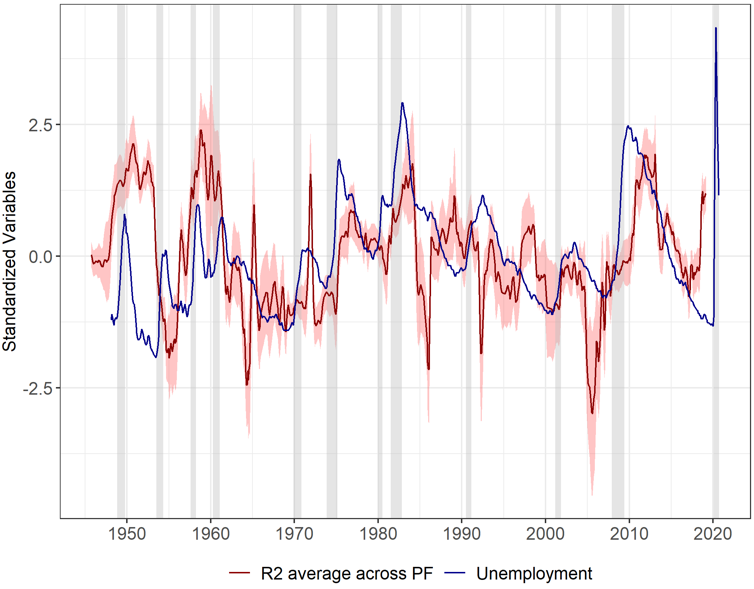
Second, we plotted in red in Graph 2 the behaviors of our alpha- and beta-predictability metrics, called the alpha- and the beta-R2, averaged across portfolios. In order to better visualize their time variations, we represented in blue: along the alpha-R2 the opposite of the Excess CAPE yield (ECY, built as the inverse of the CAPE minus a risk-free rate) and along the beta-R2 the US unemployment rate. The former has been advocated be a good metric of market effervescence (Shiller et al., 2020), while the latter stands as an intuitive variable to spot changes in the business cycle.

Regarding the behavior of the alpha-R2, the series appears positively correlated with the opposite of the US ECY. As expected, the alpha-R2 is relatively high in periods of market booms. These periods include notably the “Kennedy-Johnson peak” (Shiller, 2015) around 1966, the dotcom bubble of the late 90s and finally the period preceding the Great Financial Crisis of 2007. As for the beta-R2 the series appears also positively associated with the US unemployment rate. It rises during economic downturns, for example throughout the 1960-61 recession, in the neighbouring of the 1973- oil shock, along the Great Financial Crisis or during the recent Covid crisis.

In other words, our two estimated indices match the expected theoretical patterns: alpha-predictability rises in times of market effervescence whereas beta-predictability increases during downturns. This last finding enables to reconcile two opposite blocks of the literature: whereas previous papers tend to stress a specific source of predictability (Farmer et al., 2022, Dangl and Halling, 2012), our results suggest that the two phenomenons are at play in our sample.

Conclusion and implications for financial stability

To sum up, in this paper we underline two main results. The first one is that, when we gauge raw micro- and macro-predictability, the former does not exhibit a lower mean but a higher variance than the latter (contrary to what we called the “Samuelson view” in the introduction). The second is that, when we estimate proxies of alpha- and beta-predictability, we find that our estimated indices are consistent with their theoretical counterparts and that both sources of predictability coexist in our dataset. Eventually, we argue that our alpha-predictability index (alpha-R2) constitutes a theoretically based and easily updatable series to assess periods of irrational exuberance in real time. From a central bank perspective, along with other metrics of speculative bubbles (Shiller et al., 2020, Blot et al., 2018), it can be used for financial stability purposes to gauge potential overvaluations on the stock market.

Graph 2: Alpha- (upper panel) and beta- (lower panel) predictability over time
 width=

 width=

Note: On the upper panel of the graph are represented the average across portfolios of the alpha-predictability series (alpha-R2 in red) and the opposite of the ECY (in blue). On the lower panel of the graph are represented the average across portfolios of the beta-predictability series (beta-R2 in red) and the US unemployment rate (in blue). These monthly series have been standardized to fit in the same graph, and, for visual purposes, they have been smoothed over a 3-month period. The grey vertical bands figure the NBER US recession dates.

References

Blot, C., P. Hubert, and F. Labondance. 2018. Monetary Policy and Asset Price Bubbles. Sciences Po OFCE Working Paper 2018-5.

Cochrane, J. H. 2008. The dog that did not bark: A defense of return predictability. Review of Financial Studies 21:1533-1575.

Dangl, T., and M. Halling. 2012. Predictive regressions with time-varying coefficients. Journal of Financial Economics 106:157-181.

Farmer, L., Schmidt, L., & Timmermann, A. 2022. Pockets of predictability. Journal of Finance, forthcoming.

Henkel, S. J., J. S. Martin, and F. Nardari. 2011. Time-varying short-horizon predictability. Journal of Financial Economics 99:560-580.

Jung, J., and R. J. Shiller. 2005. Samuelson’s dictum and the stock market. Economic Inquiry 43:221-228.

Rapach, D. E., J. K. Strauss, J. Tu, and G. Zhou. 2011. Out-of-Sample Industry Return Predictability: Evidence from A Large Number of Predictors. SMU Working Paper 2-2011.

Shiller, R. J. 2015. Irrational exuberance: Revised and expanded third edition. Princeton university press.

Shiller, R. J., L. Black, and F. Jivraj. 2020. CAPE and the COVID-19 Pandemic Effect. SSRN Electronic Journal 3714737.

About the authors

Arthur Stalla-Bourdillon

Arthur Stalla-Bourdillon is economist at the International Macroeconomics Division of Banque de France and focuses on macro-financial issues involving financial and commodity markets. Prior to that, he worked also at the Financial Stability Division of the same institution. He holds two master degrees from HEC Paris and from Paris School of Economics, as well as a PhD in Finance from Université Paris-Dauphine.

More on these topics

Tags: