The views expressed are those of the authors and do not necessarily represent those of the Banque de France or the Eurosystem.
This study presents stylized facts on intergenerational household finance for the United States and the euro area. Using multiple survey waves between 2010 and 2022, we highlight the significant differences in the magnitude, distribution, and trends of various financial variables across ages in the two regions. Policymakers must consider these intergenerational disparities when formulating equitable economic and environmental policies.
While there has been a considerable body of research analyzing income and wealth disparities among households, shedding light on the distribution of financial resources across various socio-economic groups (see e.g., Atkinson et al., 2011, Krueger et al., 2016, Gomes et al., 2021, for an overall view), few studies specifically investigate intergenerational differences in household finance. This gap is noteworthy because it overlooks the distinct financial challenges and opportunities faced by different age groups, which can significantly influence their economic well-being and decision-making. Recognizing the disparities in the financial capacities of each generation is essential for designing policies that ensure that resources and opportunities are fairly distributed and that economic and environmental legacies do not disproportionately burden younger generations.
In Annicchiarico et al. (2024), we document key empirical findings on intergenerational household finance in both the United States (US) and the euro area (EA), using individual data from the Survey of Consumer Finance (SCF) and the Household Finance and Consumption Survey (HFCS). We show that the financial situation of US households has generally improved over the last decade. Older households tend to dissave less than in the EA, and there is also more variability across survey waves with an increasingly uneven distribution of income and wealth within age groups. In the EA, the improvement in the financial position of households has been modest and the 35-44 age group appears increasingly financially fragile, while the older generations seem more resilient over time.
The data are obtained from the Survey of Consumer Finances hosted by the Board of Governors of the Federal Reserve System and the Household Finance and Consumption Survey hosted by the European Central Bank. Both surveys collect information on household finances, including questions about real assets and their financing, other liabilities and credit constraints, private businesses, financial assets, and income. SCF has been conducted triennially in the US since 1992, while HFCS has been carried out across four waves (2010, 2014, 2017, and 2021) among households in all member countries of the EA. In the most recent surveys, approximately 5,000 families in the US and over 83,000 households in the EA were interviewed. The household’s characteristics are based in part on the household head, who is the economically dominant adult or the one most knowledgeable about finances in the household. To maintain the integrity of the data, the datasets were filtered to remove households that did not respond or had zero values for the financial variables (excluding income and net worth). This ensures that only subgroups of individuals who actually possess assets or debts are retained in the final datasets (Aditya et al., 2023 and HFCN, 2023). Household samples in EA countries were designed to ensure representative results at both the EA and national levels. Finally, monetary amounts are adjusted for inflation using the consumer price index for all urban consumers in the US and the harmonized index of consumer prices in the EA. Thus, the amounts displayed are expressed in constant 2022 dollars and 2021 euros, respectively.
We focus on four types of household finance variables: annual income, total assets, total debt, and net worth (defined as the difference between the last two), covering all ages from 20 to 80 years and spanning multiple periods. We summarize our findings in six key facts.
Fact 1: Income, total assets and total debt are higher in the US compared to the EA.
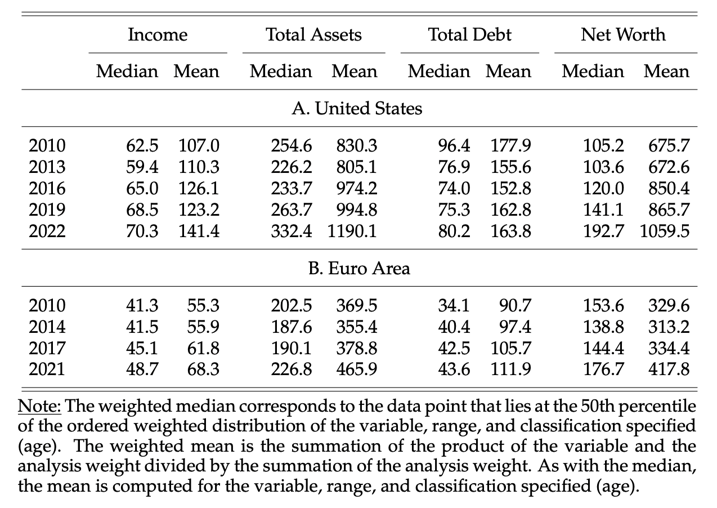
This fact is documented in Table 1, which reports the financial position of all families expressed in US dollars (PPP-adjusted). The median income in the US is around 50% higher than that in the EA, while the mean level is more than double, with the gap between the two areas widening over time. A similar trend is observed for the mean of total assets and net worth (but not for the median of the later). However, the gap in debt levels has been shrinking, with US households becoming less indebted and EA households increasingly indebted.
Table 1. Household Finance – All Families (thousands of $PPP)
Fact 2: The dispersion between survey waves is more pronounced in the US than in the EA for all the items.
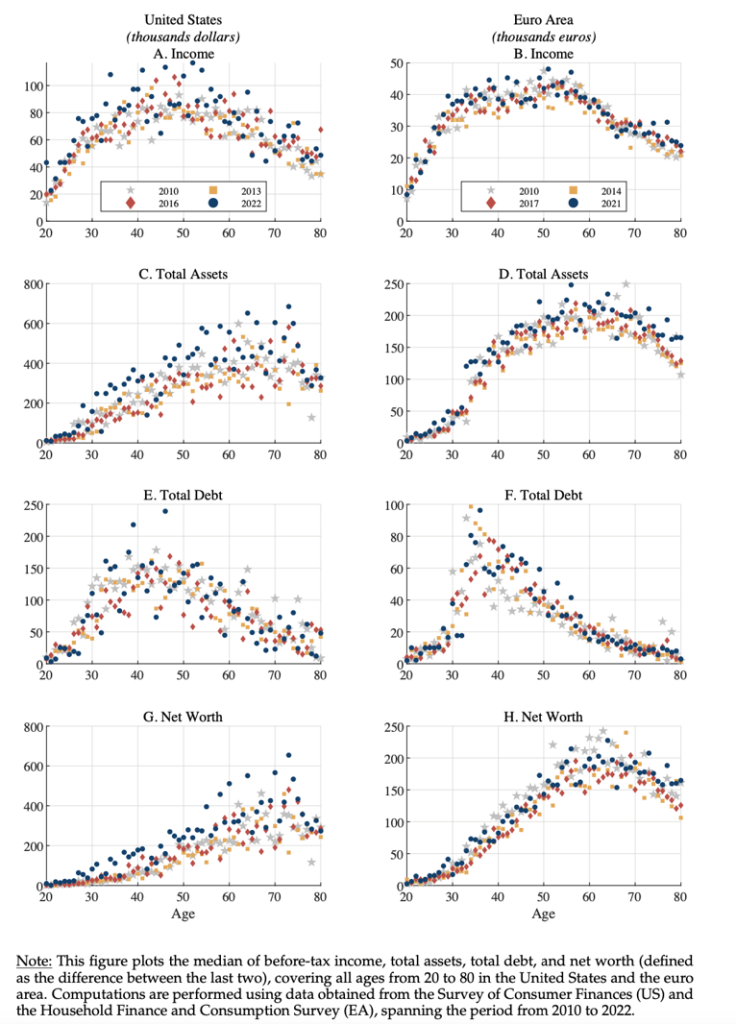
Figure 1 shows a greater degree of variability across waves for all variables in the US, with this dynamism being relatively widespread across households of different ages. In contrast, in the EA, all the variables are more stable over time. Both areas experienced a generalized contraction of median and mean levels of all items between 2010 and the subsequent wave, due to the prolonged effects of the global financial crisis and the policies implemented in response to it.
Fact 3: The income pattern displays an inverted U-shaped form across age groups for both regions but features a more extended upper tier (between the ages of 35 and 60) in the EA.
Panels A and B of Figure 1 illustrate this fact, with median income displaying a pronounced rise until the early forties in the US and early thirties in the EA and then by relative stability until age 60 in the US and 57 in the EA, ultimately declining gradually. In both areas, the age group with the highest median income is the 45-54 group, peaking at over $100K in the US in 2022 and well below €50K in the EA. While in the EA, the income gap between each group and the one with the highest income narrowed over time, in the US, this gap decreased only for the younger groups. Moreover, US household income shows consistent growth for all age groups from the first survey in 2010 to the last survey in 2022, especially for the 16-34 age group, which has experienced a 28.1% increase, and the 75+ age group, which has reported a rise of 26.2%. In contrast, from the first to the last wave in the EA, for each age group, median income growth has been much less pronounced and with more varied trends for each age group.
Figure 1. Household Finance Across Ages for Four Survey Waves (2010-2022)
Fact 4: The pattern of total assets across age groups varies substantially between the two regions, demonstrating an upward trajectory in the US and an inverted U-shaped curve in the EA.
Total assets in the US typically experience a persistent and smooth increase as individuals age until they reach their seventies, followed by a slower decline (Panel C of Figure 1). This slower wealth decumulation of older households is often referred to as the “retirement-saving puzzle” and is a phenomenon that challenges the life-cycle theory. Conversely, in line with the life-cycle model, young European age groups have a modest level of wealth, which increases sharply for households in their thirties, peaking in their sixties, around retirement age (Panel D of Figure 1). Assets then decline with age, in accordance with the expected dissaving behavior of old households. Moreover, the median value of total assets has increased over time for all age groups in the US, while the EA exhibits mixed trends, as seen for income. From 2010 to 2022, US households have seen substantial asset growth: the 16-34 age group has seen a 46.0% rise from $48.9K to $71.4K, the 35-44 age group has experienced a 45.3% increase reaching $310.4K, and the 45-54 age group has reported a 27.0% growth from $336.5K to $427.2K. In contrast, in the EA, the younger age group experienced a modest 15.0% increase, while the 35-44, 45-54, and 55-64 age groups reported declines of 5.2%, 6.7%, and 7.6%, respectively.
Fact 5: Total debt by age group exhibits an inverted V shape in both regions but with different age peaks and rates of decline.
Consistent with the life-cycle hypothesis, the debt of American households typically increases until the age of 40, at which point it begins to decrease gradually. Notably, American households tend to accumulate debt at a younger age than their European counterparts, who experience a sharp increase in debt levels between the ages of 30 and 35 years. Furthermore, the debt levels of households in the EA are only half as high as those in the US, and they also tend to repay their debt more quickly (Panels G and H of Figure 1).
Fact 6: Income and asset distributions by age group are more skewed to the right in the US than in the EA. Inequalities increased over time in both areas.
The mean-to-median ratio of income, an indicator of inequality, is substantially lower in the EA than in the US. However, this ratio increased in both regions, although to a lesser extent in the EA. The mean-to-median ratio of total assets is also much larger in the US for all age groups, indicating a more unequal wealth distribution than in the EA, except for the 16-34 age group for which, in the latest surveys, the level of this ratio is around 4.8 in the EA and 4.1 in the US. In both regions, we observe higher inequalities in the distribution of total assets among the young through different survey waves.
Our final three facts relate to the degree of financial vulnerability of households, focusing on (i) the debt-to-income ratio, which indicates a household’s ability to manage its debt obligations, and (ii) the debt-to-asset ratio, which measures the long-term solvency capacity of households.
Fact 7: While the debt-to-income ratio in the US follows a bell-shaped pattern with age, it exhibits a pointed shape in the EA, as it peaks for those in their late thirties and early forties, and then abruptly declines.
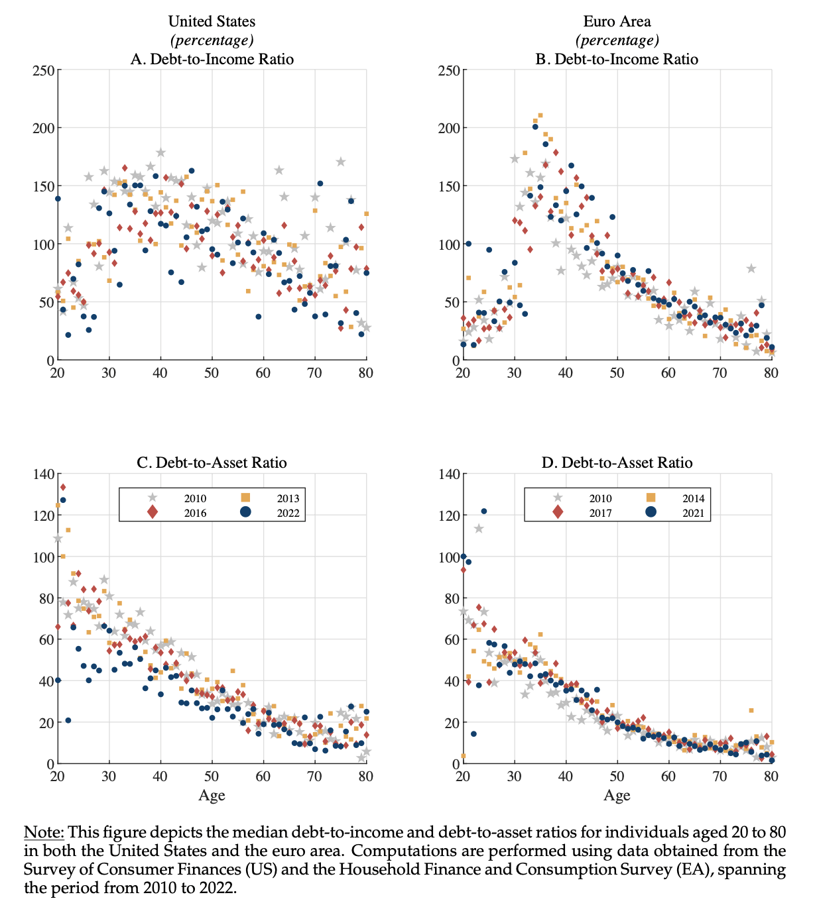
Panels A and B of Figure 2 show this result. In the US, the median debt-to-income ratio progressively increases with age, reaching a peak slightly exceeding 150% for individuals aged 30-45 years in the most recent surveys, and then gradually declines with age. In the EA, the ratio remains lower than in the US for younger age groups in all surveys except the most recent one, and then sharply increases, reaching peaks close to 200% for households in their mid-thirties who mainly use credit to finance their primary residence purchases. For older cohorts, the ratio is significantly higher in the US, confirming the greater inclination toward borrowing among US families of all ages compared to EA households.
Fact 8: Debt-to-asset ratios by age group are larger in the US than in the EA, but follow similar dynamics over the life cycle, starting high and then declining gradually with age.
Despite the similar shape across ages in the two areas, Panels C and D of Figure 2 show (i) more dispersion between waves for the US and (ii) higher financial exposure of US households compared to EA households. The latter tend to rely less on borrowing, especially when approaching the retirement age. However, the debt-to-asset ratio in the US generally decreased (by 20-25%) across all age groups, indicating improved financial stability in the last wave.
Figure 2. Financial Vulnerability Across Ages for Four Survey Waves (2010-2022)
Fact 9: The financial fragility of US households diminished throughout the survey waves, particularly for the youngest cohorts. In the EA, the tendency is mixed and notably unfavorable for the 35-44 age group.
As evident from Figure 2, the financial health of families in the US has generally improved, with a decrease in both indicators of financial vulnerability since 2010. However, between 2019 and 2022, the evidence is mixed across generations. While the 16-34 age group experienced a significant improvement in its financial resilience, other age groups did not fare as well. The improvement in financial resilience of younger households is attributed to the rise in income and asset levels relative to debt growth. In the EA, the financial situation of middle-aged households has deteriorated over time, while it has remained relatively favorable for the oldest households (65+), the only age group for which median debt-to-asset ratios have been declining steadily since the first wave.
Besides some common patterns between the EA and the US, our summary statistics reveal several intergenerational differences in the size, distribution, and trends of the financial variables. The results presented here are at an aggregate level for the EA, but as shown in Annicchiarico et al. (2024), there is also considerable heterogeneity across EA countries, particularly in the levels of indebtedness among younger and older age groups. We argue that accounting for these regional and generational disparities in household finance is essential for designing economic and environmental policies with significant implications for equity between present and future generations.
Aditya A., Bricker J., Chang A., Goodman S., Krimmel J., Moore K., Reber S., Volz A., Windle R. (2023), Changes in U.S. Family Finances from 2019 to 2022: Evidence from the Survey of Consumer Finances. Washington: Board of Governors of the Federal Reserve System.
Annicchiarico B., Clipal R., Sahuc J.-G. (2024), “Stylized Facts on Intergenerational Household Finance: A Transatlantic View”, Available at SSRN.
Atkinson A., Piketty T., Saez E. (2011), “Top Incomes in the Long Run of History”, Journal of Economic Literature, 49: 3–71.
Gomes F, Haliassos M, Ramadorai T. (2021), “Household Finance”, Journal of Economic Literature, 59: 919–1000.
HFCN. (2023), Household Finance and Consumption Survey: Methodological Report for the 2021 Wave, Statistical Paper Series #45, European Central Bank.
Krueger D., Mitman K., Perri F. (2016), “Chapter 11 – Macroeconomics and Household Heterogeneity”, Handbook of Macroeconomics, Volume 2, 843-921, Elsevier.