This Policy Note is based on “The New World Economy in 5 Trends: Investing in times of superinflation, hyperinnovation and climate transition”, Lannoo Press 2024. The opinions and views expressed herein are solely those of the authors.
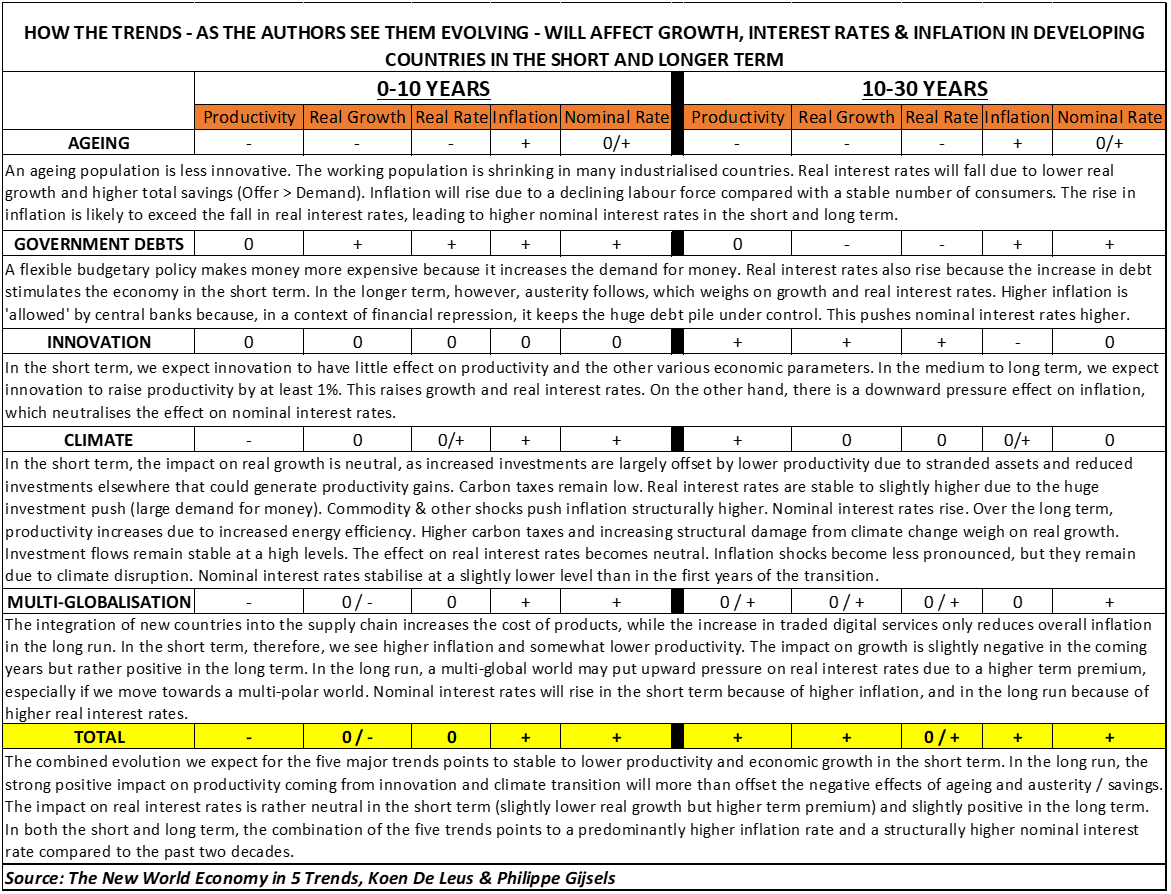
We are on the cusp of a different world, leaving behind 40 years of ever-declining interest rates and inflation. Five defining waves will sweep through the global economy. The first is climate transition, a recent trend. Then there is multi-globalisation and an innovation-driven productivity boom, both of which are shifting trends. The last two waves, ageing and rising debt, are existing trends that will kick into overdrive in the coming decades. In terms of growth, the pros and cons largely cancel each other out, but when it comes to inflation and nominal interest rates, the balance tilts towards higher levels. We are entering a world of structurally higher inflation and interest rates.
Let’s start with the new kid on the block: climate change. The challenge here is colossal. All previous energy transitions – from wood to coal to oil – were driven by technological and economic advantages and took 100 years or more each time. The current one is driven purely by policy. ‘The objective of this transition is not just to bring on new energy sources, but to entirely change the energy foundations of what today is a $100 trillion global economy – and do so in little more than a quarter century,’ explains resource specialist Daniel Yergin of S&P Global. This will require massive investments – now! The war in Ukraine has spurred investment sharply. Energy independence is suddenly right at the top of the priority list, with renewables as the saving grace. But most estimates assume another doubling of current investments of $2.4 trillion (2.5% of GDP) to meet climate goals.
In assessing the macroeconomic impact, there are the physical impacts of climate change damage, and the transition risks associated with the shift to low-carbon energy sources. In terms of physical damage, there has been a trend increase in insured losses of 5–7% annually since the 1990s (Swiss Re, 2023). In addition, both excessive heat and cold undermine labour productivity and hence growth. Regarding the transition, a major risk during the transition period is that certain technologies and products will become explicitly excluded and worthless. The longer the transition period lasts, the greater the amount of stranded assets – and the greater the economic cost. This is a big risk because, as Mark Carney points out, climate investments suffer from the ‘tragedy of the horizon’: the costs are felt immediately, while the benefits lie further in the future. As a result, policymakers are delaying action for too long.
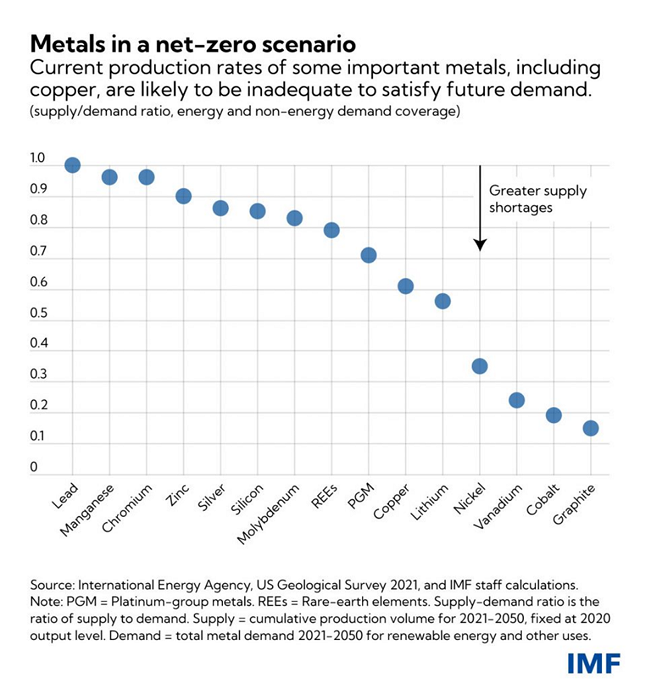
The impact of climate change on inflation is not benign. Demand for the resources needed for the energy transition exceeds supply in the short and medium term. The accompanying IMF chart illustrates the scarcity of many commodities at current levels of production relative to projected cumulative demand over the period 2021–2050. A structural shortage of necessary resources increases the volatility of inflation during the transition period and potentially pushes it higher on a sustained basis.
The same goes for energy prices. In the net zero scenario, the share of fossil fuels shrinks from 80 to 20%. The share of renewable energy increases from 10 to 60%. Some, however, are calling for an immediate end to the use of fossil fuels. We are not ready for that. Demonising fossil fuels increases the likelihood of price shocks that would quickly erode public support for the climate transition. Since 2015, global capital investment in oil and gas has more than halved. The price spike in oil and gas in late 2021 and early 2022 illustrates the problem.
These temporary price shocks risk being amplified in what the ECB calls a ‘disorderly transition scenario’ (ECB, 2021). In an orderly scenario, carbon prices and taxes are raised very gradually. The impact on inflation thus remains zero. A transition shock occurs when governments are forced to suddenly raise the ‘price’ of greenhouse gases (GHGs) sharply, after initially being too slow to respond to climate change. Companies pass on the higher emission costs in their prices. This is accompanied by higher inflation expectations among consumers and an inflation shock of 0.5–2% in the following years. Jean Pisani-Ferry of the PIEE sees similarities here with the 1970s (Pisani-Ferry, 2021), when the supply shock of expensive oil led to stagflation: a sharp slowdown in global growth coupled with high unemployment and high inflation.
Is stagflation once again written in the stars? Pisani-Ferry points to some mitigating factors. First, a global carbon price is not realistic at the moment. Second, the oil shock was completely unexpected. This is not the case with carbon pricing or similar legislative initiatives. The more gradual the transition, the less capital has to be written off.
Third, the oil shock of the 1970s resulted in an income transfer from importers to oil exporters. The latter spent much less of this extra income, which had an additional impact on growth. Today, the initial demand effect of a gradually (!) higher carbon price is likely to be neutral and may even stimulate demand in the long run. The carbon tax is a domestic transfer from the private to the public sector, which can be used for climate investments or distributed as a carbon dividend. Finally, a wave of new technological advances can be expected, potentially driving growth.
Technology also lowers inflation. Energy efficiency has offset some of the higher energy costs for companies during the energy crisis of recent years. In the medium and long term, productivity gains from the transition will emerge. Oxford Economics, in its net zero transformation scenario, estimates that global industrial energy consumption will fall by 30% by 2050, while the value added of industrial activity will increase by three-quarters (Oxford Economics, 2023). Electricity is much more energy efficient than fossil fuels.
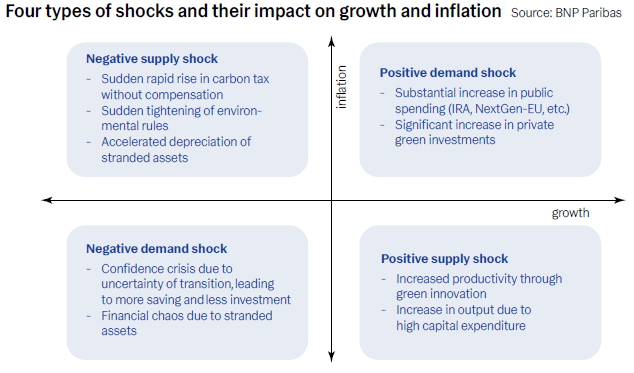
The chart shows different supply and-demand shocks and their impact on growth and inflation. The final scenario is a combination of the four. In the short and medium term, we expect an upward impact on inflation and minimal impact on growth. We continue to believe that governments will do what is necessary. In this race, price shocks will come from all sides. In the long term, productivity gains and the net zero cost of energy will depress inflation.
The climate transition has another consequence: the rising debt trend will continue, certainly taking into account the other future trends like ageing, increased defence spending and rising populism. The mountain of public debt has never been higher in peacetime. But it is pointless to look only at the size of the debt. Ultimately, it is the portability of debt that creates crises. And this portability has steadily improved over the past 40 years, thanks to a steady decline in interest rates.
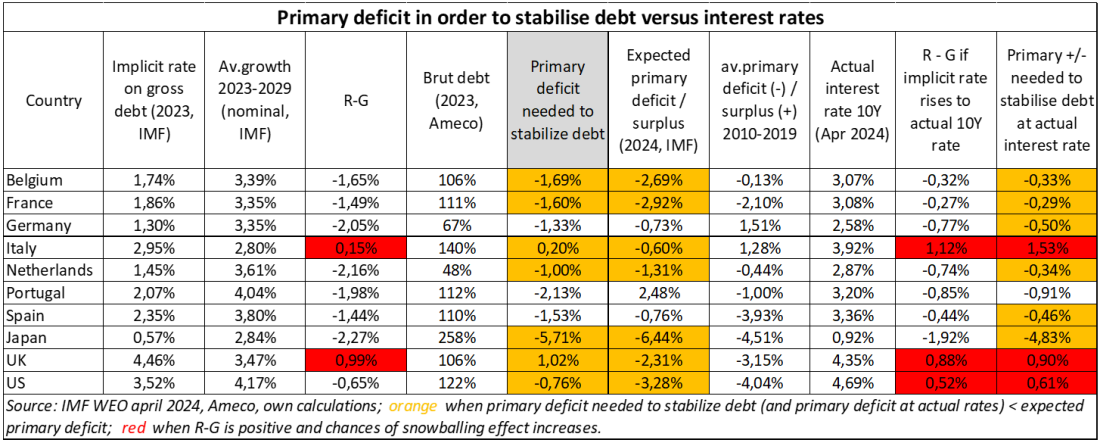
Average interest rates paid have recently started to rise again, and this is not going to change any time soon. As we see it, nominal interest rates will rise because of structurally higher inflation. If average nominal interest costs rise above nominal growth, governments will have to run primary budget surpluses to stabilise debt. If not, an interest rate snowball threatens. According to the table below, many countries will see their debt rise rapidly at the actual expected primary deficits, and the challenge increases if / when the implicit interest rates paid on gross debt gradually rise to the actual higher interest rates (see table; last and penultimate column).
The OECD makes long-term projections for interest rates. For the eurozone, the OECD expects long-term interest rates to be 2.7% by 2030, rising to 3.2% by 2060. For Japan, the UK and the US, they assume 2.5%, 3.1% and 3.3% respectively. Most countries, with the exception of Japan, are slightly above these levels today. Getting inflation under control is somewhat more difficult than expected, even in the short term.
The OECD also forecasts nominal long-term growth rates. Combined with the forecast interest rates, this produces the all-important R-G snowball lever. And the conclusion there is uninspiring: for almost all industrialised countries, long-term interest rates exceed expected growth from 2040 onwards. The difference is limited: between 0.05 percentage points for Belgium and 0.4 to 0.5 percentage points for Spain and Italy. But the hitherto positive leverage is slowly coming to an end. Governments would do well to start putting their budgets in order.
We have seen different periods of very high debt in industrialised countries in the past (B. Eichengreen et al., 2021). In the period from the 19th century to the First World War, the debt ratio declined mainly due to budget surpluses. After World War I and the rise of the welfare state, the contribution of budget surpluses became more proportional, together with low implicit interest rates and higher nominal growth (R-G). During and after the Great Depression, debt was eliminated through defaults, restructurings and, in some countries, hyperinflation. And from 1945 to 1975, financial repression brought down skyrocketing debt. Government measures and legislation squeezed debt and the interest charges on it. Combined with a dose of inflation, real interest rates turned negative. During this period, growth exploded due to productivity gains. So R-G became even more negative.
So what are the solutions to our debt today? We believe that financial repression, including periods of negative real interest rates, is undoubtedly part of future deleveraging. 3% will be the new 2% inflation target in the medium and long term, although this is unlikely to be stated out loud. However, real interest rates are likely to remain higher than in the past decade due to a higher term premium. Central bankers will continue to buy bonds on a regular basis – if necessary – to put additional downward pressure on interest rates. Savings will be needed, as will higher government revenues. But given the many challenges ahead, it will not be possible to achieve budget surpluses this time. This must not be fatal for debt sustainability. Only if governments abandon all fiscal discipline will bond markets push interest rates sharply higher, risking that highly indebted countries get into trouble.
Ageing is another trend that will push debts higher. According to our Ageing Vulnerability index, Anglo-Saxon countries are on average the least vulnerable to the explosion in ageing costs because of the relatively small share of public pensions in total pensions. Japan, the UK and most Scandinavian countries show medium vulnerability. We find high vulnerability in northern and southern European countries. They combine a rapidly ageing population with already high taxes and significant debt.
Ageing Vulnerability Index – Ageing will hurt Belgium even more
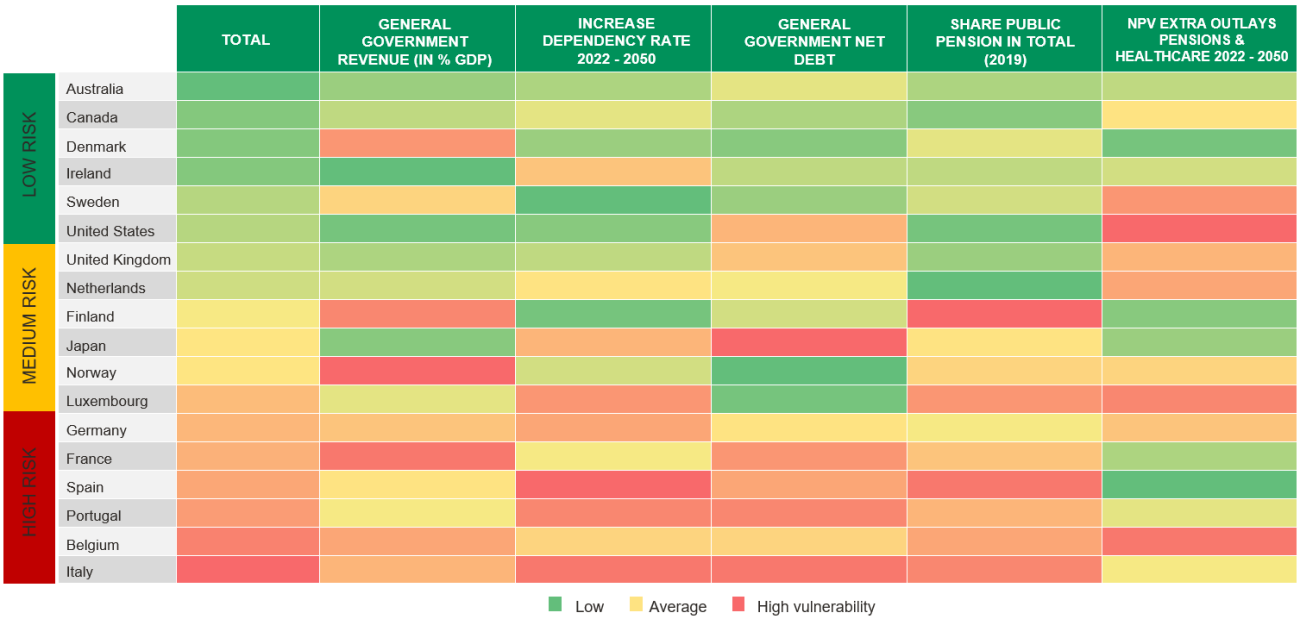 Source: The New World Economy, Koen De Leus, Philippe Gijsels.
Various studies by the US central bank (E. Gagnon et al., 2016; C. Carvalho et al., 2017) and the Bank of England (N. Lisack et al., 2017) estimate that demographic changes have pushed down real interest rates by 1.25 to 2%-points, mainly due to an increased supply of savings. This downward pressure on interest rates is expected to continue. According to Gertjan Vlieghe, a former member of the Bank of England’s rate-setting committee, the substantial savings accumulated by middle-aged and older people more than compensate for the modest decline in savings by pensioners (G. Vlieghe, 2021). ‘The crucial insight is that this demographic transition revolves around the desired asset position [savings stock] of the entire population rather than the savings flow of the elderly,’ says Vlieghe.
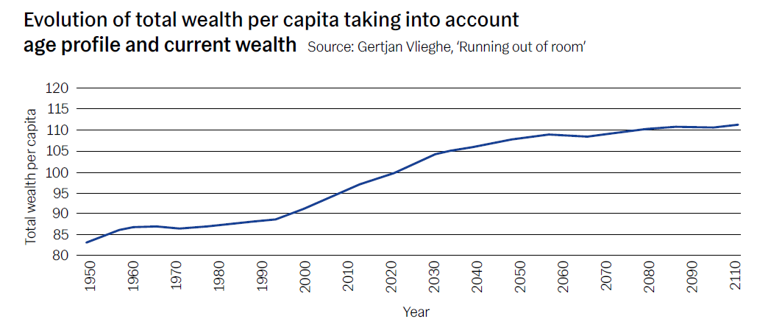
A growing segment of the population has a higher desired level of savings to finance their retirement. People in their 50s have much more wealth than they did in their 40s. In the UK, wealth peaks around the age of 65. Vlieghe shows that the extra savings from the larger middle-aged group exceed the modest disbursements of pensioners. The group aged 60–90 is expected to experience the fastest growth over the coming four decades. If the number of assets per age profile stabilises at current levels, how will the total amount of assets or the average amount of assets per citizen change in the future?
‘The ageing effect has increased the asset ownership per citizen over the past thirty years (see graph). This process is far from over and, to all expectations, will not reverse. In fact we are only two thirds of the way into this demographic transition.’ The impact on the equilibrium interest rate also partly depends on the extent to which people of a certain age anticipate life expectancy to increase and would therefore save even more. Vlieghe concludes: ‘Either there will be more downward pressure on the equilibrium interest rate, or it will simply remain low. There is no upward pressure of a demographic nature, neither in the short term nor the long term.’
Demographic changes affect the real R*. Inflation becomes relevant when determining the long-term interest rate. Demographic trends may have helped suppress inflation in the last decades. The overall ratio between the number of workers (taking into account labour force participation, unemployment, etc.) and the number of consumers reached its lowest point in the 1970s. In the three decades that followed, the number of working individuals rose faster as more women went to work and the number of dependent children per household decreased. This rising ratio of workers to consumers corresponds to an increase in the ratio of production to consumption. A rising support ratio is therefore deflationary: it pushes prices down.
Nevertheless, beginning in 2010 in the US and a few years later globally, the support ratio began to fall. Baby boomers are retiring, but still spending. A decline in the number of workers relative to consumption points to inflation. The rising share of health services for the elderly in this consumption also contributes to this. The costs of healthcare services, where efficiency gains are difficult to realise, are rising faster than costs in the goods producing sectors.
The rising costs of ageing will be passed on to workers in the form of higher taxes, or workers will choose / have to work longer. These workers will not accept their fate helplessly this time. The tightness of the labour market gives them negotiating power, and they will use it to negotiate higher wages. At the same time, politicians will be under pressure from an older electorate to accommodate their caregivers. Wage inflation in these and other sectors ultimately leads to higher overall inflation in the future.
This is also the conclusion of a study by the BIS (M. Juselius & E. Takáts, 2018). ‘We find a link between a population’s age structure and inflation, in line with the life-cycle hypothesis,’ the authors say. ‘A larger share of young and old in the population is associated with higher inflation. Conversely, a larger share of working-age people is associated with lower inflation. The finding is statistically significant.’ The age structure and changes therein explain a large part of inflation trends over the long term, both at the national and global level. ‘In the US, for example, it represents a 7 percentage point increase from the 1950s to the mid-1970s, and a similar decline since the 1980s.’
What lies ahead? ‘Based on this historical relationship, it predicts rising inflation over the coming decades.’ Over the past fifty years, the rising share of people of working age has reduced average inflation by three percentage points. Over the next half-century, the rise of the elderly will dominate, resulting in a 3% increase in average inflation. For rapidly ageing countries, such as Italy and Spain, this is slightly more. However, for all individual countries, there is an upward effect.
The final inflationary trend we studied is de-globalisation. We talk about multi-globalisation because we expect more emerging markets to take their place in the supply chain in the medium term, either as a stopover between China and the West or as a new supply channel. These countries will fully embrace globalisation and the growing trade of goods between them and the industrialised countries will offset the slowing trade between China and the US (and later on Europe?). The second facet of multi-globalisation is the digitalisation of the service industry. This is opening – and has opened – a whole new and fast-growing market of traded digital services.
Globalisation has increased productivity through the diffusion of knowledge and increased competitiveness between countries and firms. Lower prices for goods due to increased trade with China have greatly increased the purchasing power of the average global family. Cross-border trade has increased since the Bretton Woods Agreement of 1944 and accelerated with the fall of the Soviet empire and the opening up of India and China in the 1980s. This further lowered labour costs and hence inflation. There is no doubt that globalisation has depressed inflation and interest rates in recent decades.
After accelerating since 1980, merchandise trade as a percentage of GDP is now likely to have peaked. This is partly due to the different composition and price trends of the numerator (goods) versus the denominator (goods and services). The ratio of trade in goods to GDP has been falling as GDP, in particular the prices of services within it, have been rising relatively faster. The ratio has increased since the 1990s due to the price explosion of mining products and fuels in the denominator. Until it peaked in 2011. ‘60% of the fall was due to a phenomenon known as the “commodity supercycle”,’ concludes professor Richard Baldwin (R. Baldwin, 2022). In addition, the outsourcing of the manufacturing process reached its limit in 2008 and companies want to reduce the complexity of the global value chain.
Although much of the peak is due to falling commodity prices, slowbalisation is happening and will continue. The US, led by Joe Biden, remains hostile to free trade and trade agreements. China is the big bogeyman: it does not play the trade game fairly and threatens the US in its hegemony. In Europe, as well, there is growing resentment about unfair Chinese trade practices. The symbiosis of past decades – technology in exchange for a huge market – is in jeopardy as China enters the European market with its own high-tech products such as electric cars.
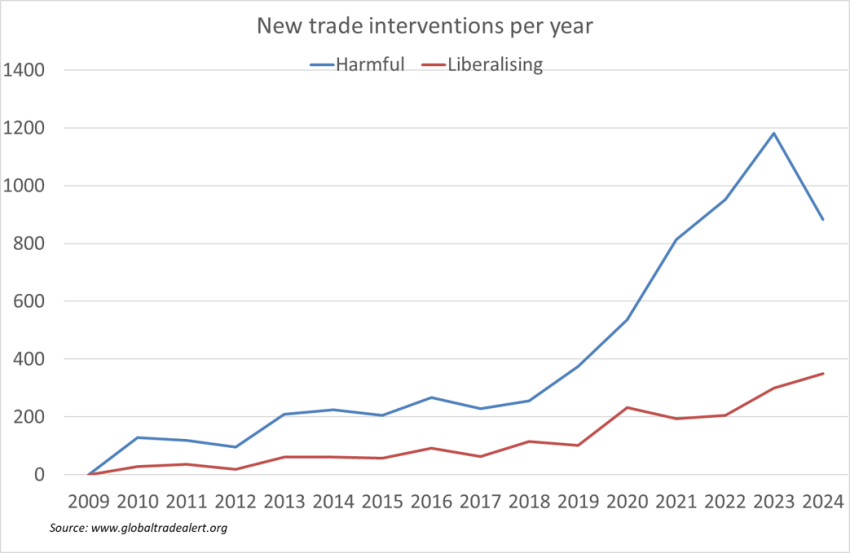
Blocking Chinese goods from US or European markets would prompt a response from China, which is dominant in the supply chain of rare metals and critical minerals. Future commodity shocks due to export restrictions are guaranteed. Harmful trade interventions have soared in the past years and will continue to do so. Industrial plans such as the US IRA, the European Green Deal Industrial Plan and the Chinese Five-Year Plan, among others, are also being implemented. Europe, in particular, is using non-trade barriers to reduce carbon emissions in the supply chain. In 2024, the new Corporate Sustainability Reporting Directive will come into force, increasing the pressure on suppliers to meet stricter requirements. There will be increasing trade restrictions between the European Union and emerging markets due to new regulations to combat deforestation (the Deforestation-free Regulation1). And from 2026, the first carbon border tax will be introduced, which emerging markets call ‘one-sided’ and ‘discriminatory’. Costs for companies are rising, as is inflation as these costs are passed on to their customers and clients.
If the trend towards de-globalisation intensifies, the IMF has calculated that technological will increase global economic losses to as much as 5% of GDP (D. A. Cerdeiro et al, 2021). Inflation will be pushed higher: in the short run through temporary shortages and adjustment shocks, and in the longer run through structurally higher costs as the most (cost) efficient supply chain is closed. The positive impact of globalisation on inflation disappears in a world with more barriers and regulation. Moreover, a fragmented international financial system increases complexity, risk, and hence costs. This depresses global growth and raises interest rates and, again, inflation. However, we are still a long way from such a dire scenario. In the medium to long term, we also believe that multi-globalisation will compensate for some of these negative effects, with increased trade in services in particular weighing on inflation and increasing productivity.
Against these four inflationary trends, we see one trend that could partially or fully offset their inflationary impact: productivity and innovation. Increasing productivity is the only source of future growth for ageing Western economies. It is therefore worrying that this source has become increasingly depleted in recent decades. The computer revolution was followed a decade ago by the digital revolution. So far, it has not brought a major acceleration in growth. Consumers may enjoy greater well-being, more tools and apps that make their lives easier and, above all, more enjoyable. But it has not had a concrete impact on our prosperity, on GDP. It has created consumer surplus, but not producer surplus. Only producer surplus is included in GDP.
Why should productivity rise in the coming years, when it has been on a steadily declining path over the past 40 years in Europe and the last 15 years in the US? It has to do with the wider spread of many exponentially fast-evolving technologies. According to technology expert and author Azeem Azhar, exponential technologies improve at a rate of at least 10% per year for several decades at a constant cost (A. Azhar, 2021). ‘The threshold of 10% per year is important. A 10% compound improvement in the price and performance of a technology would result in it becoming more than 2.5 times more powerful for the same price every 10 years. Conversely, for the same level of performance, the cost would fall by more than three fifths. […] For a technology to be exponential, this change should hold true for decades – and not just be a short-lived trend.’ Examples of such technologies include artificial intelligence (AI) and ChatGPT, 3D printing, (green) energy, and biology. The unique thing about these technologies is that as their price comes down, they pop up everywhere. And the more widespread they become, the faster productivity growth will be.
Over the past decade, we have seen an acceleration of innovation and dynamism in large technology companies. But raising productivity requires wider diffusion of new technologies, which has not been the case so far. Weak growth in the aftermath of the global financial crisis has slowed business investment in IT. Supply-side growth in new technologies, which has certainly been there in recent years, is not enough. We also need demand growth through household consumption and business investment. Rising inequality and deleveraging have hampered this over the past decade.
So what are the conditions for productivity to finally pick up? We often get a trend reversal after major shocks such as wars, global financial crises, supply shocks and major political changes, argue Antonin Bergeaud et al. of the Banque de France (A. Bergeaud et al., 2016). These are often accompanied by major institutional reforms and other trend breaks. Productivity rose sharply from 1939 to 1973, but also after World War I, thanks to the spread of new technologies and a recovery in demand.
We have not been spared shocks in recent years. In early 2020, the coronavirus turned the world upside down. Companies accelerated the digitisation and automation of their business processes during the Covid pandemic, especially in the service sector and among SMEs. These are the traditional laggards in productivity, which means that new technologies are now more widely used.
In 2022, the war in Ukraine, primarily in Europe, led to a new supply and energy shock. This has accelerated the energy transition, leading to a tidal wave of productive investments, partly because far too little has been invested in recent decades. Reforms are pushed through in exchange for subsidies and cheap loans. But these productivity-enhancing factors are counterbalanced by a flood of new green regulations. These gobble up a lot of unproductive adaptation investments and assets that have to be written off early. On top of that, two very important negative factors for productivity are the (temporarily high) cost of energy and deglobalisation. So the signs of an imminent increase in productivity are not all pointing in one direction. Besides, as we have seen in the past, the widespread rollout of new technologies and their impact on productivity takes decades.
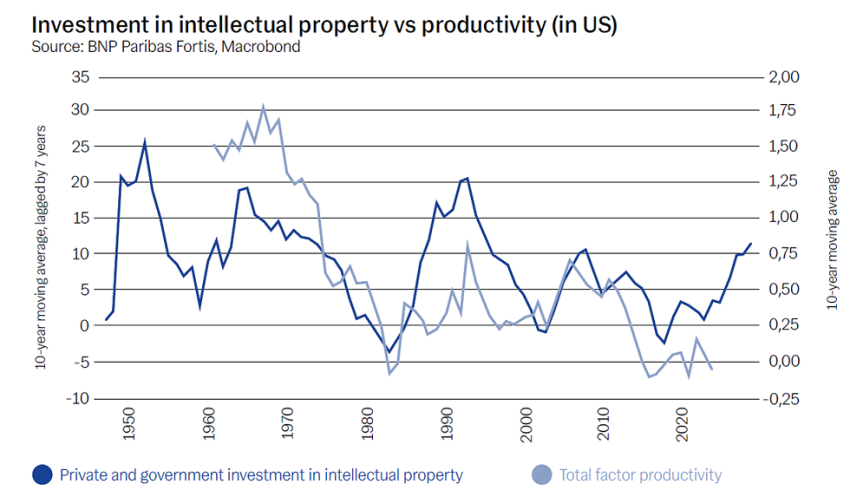
Hopeful signs, however, are emerging. The prices of exponential technologies are coming down fast in order to be widely deployed. There have been shocks. And there is the rise in US private and government investment in intellectual property (IP). The graph shows the relationship between this investment and total factor productivity (TFP). Investment, especially in IP, has been at the root of accelerating productivity in the past. In the US, spending on IP grew by around 8% a year between 1980 and 2000. Since then, it has slowed down, and since the global financial crisis of 2007–2008, it has stopped altogether. US productivity followed with a lag of about 7 years. In recent years, overall investment in IP has picked up. If the past is a guide to the future, productivity will follow.
On top of that, research by the investment bank Goldman Sachs shows that productivity always returns to its long-term mean (Goldman Sachs, 2021). Over the past 140 years, US total-factor productivity (TFP) appears to be stable, with alternating cycles of acceleration and deceleration around an annual average of 1.2%. After a long trek through the desert, fruitful years lie ahead. By the way, it should be noted that in Europe and the UK, even more than in the US, productivity growth has only declined in recent decades.
On balance, we conclude that in the short term we expect little change in productivity and its impact on the various parameters. In the long term, we see innovation pushing up productivity significantly. This drives real growth and real interest rates and weighs on inflation. The effect on nominal interest rates is neutral. Increased productivity can also, probably partly, offset the upward effect of the other four inflationary effects mentioned. However, taking all 5 trends into account, we expect an upward impact on inflation and nominal interest rates in the short and long term.
‘Natural catastrophes an inflation in 2022: a perfect storm’, Sigma, Swiss Re Institute, No 1/2023.
‘Climate Change And Monetary Policy In The Euro Area’, ECB, September 2021.
J. Pisani-Ferry, ‘Climate Policy is Macroeconomic Policy, and the Implications Will Be Significant’, Peterson Institute for International Economics, August 2021.
‘Sectoral Winner And Losers Form The Energy Transition’, Oxford Economics, 1 March 2023.
B. Eichengreen et al., In Defense Of Public Debt, Oxford, 2021.
E. Gagnon et al., ‘Understanding the New Normal: the Role of Demographics’, Finance and Economics Discussion Series, Board of Governors of the Federal Reserve System, 2016.
C. Carvalho et al., ‘Demographic Transition and Low US Interest Rates’, Federal Reserve Bank of San Francisco Economic Letter, 2017.
N. Lisack et al., ‘Demographic trends and real interest rate’, Bank of England Staff Working Papers, 2017.
G. Vlieghe, ‘Running out of room: revisiting the 3D perspective on low interest rates’, 26 July 2021.
M. Juselius & E. Takáts, ‘The enduring link between demography and inflation’, BIS Working Papers No 722, May 2018.
R. Baldwin, ‘The Peak globalization Myth: Part 2’, VoxEU, 1 September 2022.
D. A. Cerdeiro et al., ‘Sizing Up the Effects of Technological Decoupling’, IMF Working Paper, March 2021.
A. Azhar, ‘Exponential’, New York, 2021.
A. Bergeaud et al, ‘Productivity Trends In Advanced Countries Between 1890 And 2012’, Review Of Income And Wealth, 62(3), September 2016.
‘Global Economics Comment: Technology and the Productivity Rebound (Zhestkova)’, Goldman Sachs, 19 November 2021.
The Deforestation-free legislation aims to ensure that raw materials such as palm oil, soya, beef, coffee, cocoa, rubber, timber and related products imported into the EU do not contribute to deforestation. Controls are carried out through strict traceability requirements and enforced with fines for violators of up to 4% on annual EU business income.