This policy brief is based on DNB Working Paper No. 827. The views expressed are those of the author and do not necessarily reflect those of De Nederlandsche Bank or the Eurosystem.
Abstract
This policy brief examines the asset allocation problem faced by long-term investors seeking exposure to illiquid private asset classes. In a recent working paper (Dimitrov 2025), I examine how the liquidity uncertainty embedded in these assets complicates the asset allocation problem. In a quantitative dynamic asset allocation model I find that while adding private assets to the investment universe may offer benefits, ignoring illiquidity in the portfolio construction process may also lead to substantial welfare losses.
Institutional investors, such as pension funds, sovereign wealth funds, and endowments, have increasingly allocated capital to private asset classes in search of improved risk-adjusted returns and diversification. Conventional wisdom suggests that these investors’ long horizons allow them to capitalize on the illiquidity premia potentially offered by private assets. However, the illiquidity of non-traditional asset categories—including private equity, private real estate, infrastructure investments, and hedge funds—poses a significant challenge to traditional asset allocation methods which quantify risk only from an asset variance point of view (Markovitz, 1952). While the literature addressing these challenges is growing (Terhaar et al., 2003; Luxenberg et al., 2022; Korteweg and Westerfield, 2022; Dimmock et al., 2023), there remains a lack of theoretical understanding of how these difficulties impact investors and how this additional source of risk can be incorporated into the portfolio construction process. Moreover, the practical tools that can handle illiquidity risk in allocation models are still missing.
Illiquidity hampers the investors’ ability to rebalance continuously and to withdraw from the investment portfolio. In addition, illiquidity risk premia and withdrawals (consumption) out of the liquid portion of the portfolio lead to unintended overallocation to the private asset, especially during extended periods of asset lock-ups. These factors constrain the core function of long-term investments – the ability to generate a return that can be consumed over time – and as a result shrink investor welfare.
This note, and the underlying paper, highlights this illiquidity risk —the fact that private asset classes typically lock up invested funds for an uncertain period — and looks for an optimal strategy to construct the asset allocation targets of the investment portfolio taking into account this risk. To address this problem, I provide a dynamic portfolio choice model that combines insights from theoretical finance (Ang et al., 2014) and computational economics (Cai et al., 2013) with a practical approach to portfolio construction. The resulting model can still be calibrated based on investors’ capital market assumptions (CMAs) with only one additional input — the expected time the investor needs to wait before the allocation to the private asset can be adjusted back to the strategic targets. The investor then needs to solve in a multiperiod dynamic model for the strategic allocation to all asset classes in the investment universe, the optimal consumption rate out of the portfolio, and the optimal tactical adjustments for the periods over when she does not have control over the private asset allocation.
With this approach, I solve for the optimal allocation for a portfolio mixing traditional liquid asset classes with illiquid private asset classes. Furthermore, I assess the true welfare benefits of including a private asset class in the portfolio, factoring in also its illiquidity cost, and I evaluate the losses associated with constructing a portfolio with an over-optimistic allocation to private assets when illiquidity risk is ignored.
In contrast to the static models, widely used in practice, which look purely through a mean-variance lens, and construct an optimal portfolio only one period ahead (Markovitz, 1952), here I use a dynamic portfolio allocation model in the style of Merton 1971. This means that optimal allocations have a temporal dimension, and investors are aware that they can adjust their holdings over time based on the realized asset dynamics, giving rise to different incentives for intertemporal hedging (Campbell & Viceira 2002, Cochrane, 2022). In the context of illiquid assets, the temporal dimension allows for modeling illiquidity risk in a setting in which investors do not know when they will be able to adjust the holdings of the private asset class back to its strategic budget. They can, however, form a view on the expected waiting time for this liquidity opportunity to arrive. This implies that in constructing their strategic portfolio, agents have to take into account the fact that over shorter horizons, there is only a small chance that they will be able to readjust the portfolio allocations back to the strategic optimum when they float away from optimality. As a result, with private asset classes, the share allocated to the illiquid asset is not fully under the control of the investor.
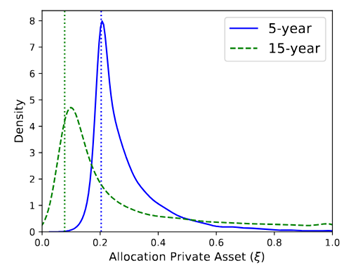
Figure 1 shows a model simulation of the realized share of the illiquid asset over time for a long-term optimizing investor that can rebalance continuously the liquid assets in the portfolio and infrequently the illiquid asset class. In addition, the investor decides continuously how much to consume out of the (liquid) portfolio. The plot compares the distribution of the illiquid private asset share with two different assumptions on illiquidity risk – a moderately illiquid asset with a 5-year expected waiting time until its share in the portfolio can be rebalanced, and a severely illiquid asset with 15-year waiting time.
First, we can see that with a higher expected waiting time, the investor reduces the strategic (budgeted) allocation in the private asset from about 25% in the moderately illiquid case to about 10% in the severely illiquid case (indicated by the vertical dotted lines). This reduction results despite the fact that the variance of the private asset class has remained fixed.
Second, it becomes clear that in both cases, the realized allocation tends to float significantly above the budgeted, both in terms of the mode (the peak) of the distribution and in terms of the fat right tail notable in both cases. Based on this simulation, we can see that even with a 20% strategic allocation to the private asset classes and a 5-year waiting time for full liquidity there is a significant chance of its realized allocation doubling and reaching 40% of the portfolio in some periods.
Figure 1. Simulated realized (distribution curves) and budgeted strategic allocation (vertical lines) to the private asset class. Allocation numbers in decimals.
In a stylized parametrization of the model, I find that the characteristics that are often cited as advantages of private asset investing, higher returns, and diversification potential, are the ones that can interact negatively with their illiquidity risk. In particular, the low correlation between private assets and the rest of the portfolio reduces the possibility of investors to diversify or to hedge the uncontrolled movements in the private asset allocation through liquid investments. If the private asset is expected to outperform, on the other hand, for example, it can harvest any potential market illiquidity premia (evaluated at about 3% per year in Franzoni et al. 2012), then with extended periods of illiquidity, the private asset will tend to dominate the portfolio. From that point of view, in both of these cases, the safeguarding of additional liquid buffers invested in the risk-free asset becomes necessary to ensure stable portfolio consumption over time.
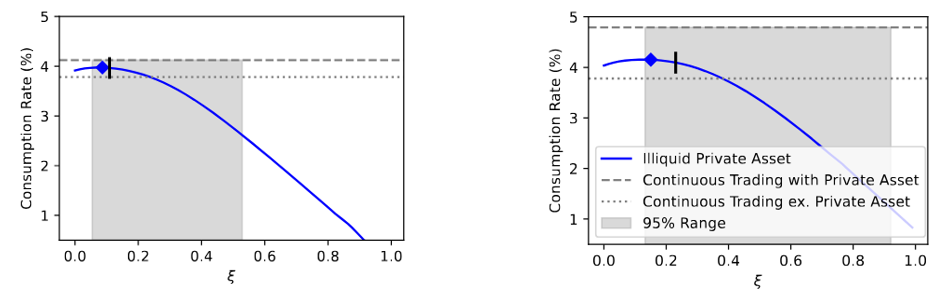
The two charts in Figure 2 compare the optimal consumption rate with an illiquid private asset (solid blue curve) against the optimal consumption rate without it (lower dotted line), and the optimal consumption rate derived from a similar model which does not account for illiquidity (upper dashed line; Merton, 1971). First, the gap between the two horizontal lines shows the overall potential for consumption improvement by investing in the illiquid private asset. In figure (a) I assume a case in which the private asset class has zero correlation with the rest of the portfolio and bears no illiquidity premium. In figure (b) I assume 80% correlation and a risk premium of 3%. As can be expected, the potential to improve consumption (the gap between the horizontal lines) is higher when the private asset offers stronger diversification potential, as in figure (a), or when it offers high illiquidity premium, as in figure (b).
The optimal consumption rate with illiquidity (ten-year expected waiting time) is illustrated in the solid blue curve in the charts. In this case, illiquidity prevents the full realization of the potential of the illiquid asset class, and when its share in the portfolio gets too high, the investor is forced to curb consumption. This is captured by the downward-sloping curve in the right section of the charts. As illiquidity introduces choice dependence on the realized (and not fully controlled) private asset allocation, the investor will need to adjust down consumption rate below the portfolio potential whenever the realized allocation to the private asset drifts significantly above its strategic budget. In the figure the diamond at the top of the solid curve shows the budgeted consumption rate at the strategic optimum, and the vertical arrow shows the realized median consumption rate over time. The shaded grey area in the figure shows the 95% range of realized consumption rates in a simulated model run. The cost of illiquidity becomes particularly evident when the blue curve falls below the lower dashed line, indicating that consumption is reduced even below the level that is achievable without the private asset in the portfolio.
Figure 2. Optimal portfolio consumption rate as a function of the illiquid asset share (solid blue line).
The grey area shows a 95% interval based on the distribution of the realized illiquid private asset share (ξ).
To quantify the benefits and the costs of investing in private assets I proceed by defining a measure of the allocation benefits and the misallocation costs associated with the illiquidity of private asset classes. To do so, I use a concept originating from decision theory: Certainty Equivalent Consumption (CEC) measures the risk-free consumption stream that an investor would be willing to accept in exchange for a risky consumption stream. For risk-averse investors, the CEC will be lower than the expectation of the risky consumption stream. Then, I define the Allocation Benefit as the improvement in CEC consumption when the private asset is included in the investment universe and the investor chooses optimally its allocation, compared to a portfolio consisting only of liquid assets. In both cases, the portfolios are optimized with respect to the assets included in the investment universe.
Also, I define a measure of the Misallocation Risk, the cost of Ignoring the illiquidity of private assets when constructing the portfolio. This leads to an over-optimistic allocation that can constrain future portfolio consumption. The misallocation risk is defined as the potential welfare loss from assuming continuous rebalancing opportunities for private assets. The greater the illiquidity of the asset, the higher the associated misallocation risk.
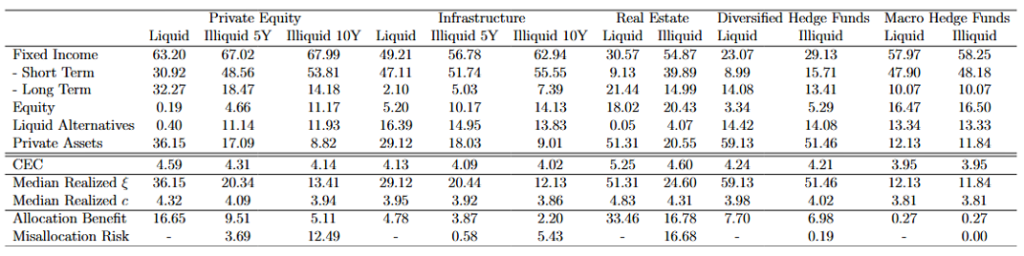
Finally, I study the optimal strategic allocation to a variety of private asset classes, utilizing the publicly available CMAs for 2025 compiled by JP Morgan. The CMAs provide a forward-looking assessment of returns, risks, and correlations for both the publicly traded and the private assets. Using CMAs rather than historical data avoids biases inherent in private asset returns, such as over-smoothing due to infrequent trading and selective performance disclosure by private equity managers (Ang, 2014). The additional input, relative to standard SAA optimization approaches, is the calibration of the illiquidity risk factor. I based this on academic estimates of the median exit times for different private asset classes. Private equity and infrastructure investments typically exhibit median exit times of five to ten years (Andonov et al., 2021; Metrick and Yasuda, 2010), while real estate investments having redemption periods of about five years (Fisher and Hartzell, 2016). Hedge funds, in contrast, feature much shorter illiquidity horizons, with lock-up periods typically lasting around a year (Schaub and Schmid, 2013).
Table 1 shows the optimal strategic allocations based on the dynamic allocation model presented earlier. First, comparing in each case the column ‘Liquid’ against the columns ‘Illiquid’, I find that incorporating illiquidity risk significantly lowers the allocation to the private asset class. For instance, when private equity is assumed to be fully liquid, its allocation can reach 36.15%, but when realistic illiquidity constraints are considered, it drops to 17.09% for a five-year waiting period and further to 8.82% for a ten-year waiting period. Similarly, real estate and infrastructure investments experience significant allocation reductions, often substituted by their publicly traded equivalents such as REITs and listed infrastructure stocks.
Second, it also alters the composition of the liquid sub-portfolio. Notably, short-term fixed-income allocations increase in order to provide liquidity buffers and to lower the variance of the liquid sub-portfolio.
Overall, I find that the inclusion of private equity, infrastructure investments, private real estate, and hedge funds at the proper optimal levels enhances investor welfare (measured by the improvement in CEC). However, the benefits are significantly tempered when illiquidity asset class characteristics. However, ignoring the illiquidity risk of these assets by focusing only on the mean-variance portfolio trade-offs leads to over-optimistic (mis)allocations and may result in significant welfare losses, particularly for highly illiquid assets like private equity and infrastructure.
Table 1. Optimal Strategic Asset Allocation with Traditional and Illiquid Private Asset Classes
The integration of private asset classes into institutional portfolios presents a double-edged sword. While they may offer an option to reap any illiquidity premia and may offer some diversification benefits, their illiquidity creates challenges that can undermine investor welfare if not properly accounted for. This study highlights the necessity of embedding liquidity risk into strategic asset allocation models to avoid misallocation and optimize long-term portfolio performance. Institutional investors who fail to account for illiquidity constraints risk overexposing themselves to private assets, leading to constrained portfolio consumption and significant welfare losses.
By leveraging a dynamic allocation model calibrated with forward-looking capital market expectations, this study provides a practical framework for assessing the trade-offs between return enhancement and liquidity risk management in private asset investments. Policymakers and investment managers alike should consider these findings when designing allocation strategies to ensure optimal long-term portfolio outcomes. The full analysis and details on the numerical methodology to solve the strategic optimization problem are available in the related paper Dimitrov, 2025.
Andonov, A., Kräussl, R., and Rauh, J. 2021. Institutional investors and infrastructure investing. The Review of Financial Studies, 34(8):3880–3934.
Ang, A., Papanikolaou, D., and Westerfield, M. M. 2014. Portfolio choice with illiquid assets. Management Science, 60(11):2737–2761.
Ang, A. 2014, Asset Management. Oxford University Press
Cai, Y., Judd, K. L., and Xu, R. 2013. Numerical Solution of Dynamic Portfolio Optimization with Transaction Costs. NBER Working Paper No. w18709.
Campbell, J. Y., & Viceira, L. M. (2002). Strategic asset allocation: portfolio choice for long-term investors. Clarendon Lectures in Economic.
Cochrane, J. H. (2022). Portfolios for long-term investors. Review of Finance, 26(1), 1-42.
Dimitrov, D., 2025. Untangling Illiquidity: Optimal Asset Allocation with Private Asset Classes. De Nederlandsche Bank Working Paper No. 827, Available at SSRN: https://ssrn.com/abstract=5118823 or http://dx.doi.org/10.2139/ssrn.5118823
Dimmock, S. G., Wang, N., & Yang, J. (2024). The endowment model and modern portfolio theory. Management Science, 70(3), 1554-1579.
Fisher, L. M. and Hartzell, D. J. 2016. Class differences in real estate private equity fund performance. The Journal of Real Estate Finance and Economics, 52:327–346.
Korteweg, A., & Westerfield, M. M. (2022). Asset allocation with private equity. Foundations and Trends® in Finance, 13(2), 95-204.
Luxenberg, E., Boyd, S., van Beek, M., Cao, W., & Kochenderfer, M. (2022, November). Strategic asset allocation with illiquid alternatives. In Proceedings of the third ACM international conference on AI in finance (pp. 249-256).
Markowitz, H. (1952). Portfolio Selection. The Journal of Finance, 7(1), 77–91.
Merton, R. C. 1971. Optimal consumption and portfolio rules in a continuous-time model. Journal of Economic Theory, 3:373–413.
Metrick, A. and Yasuda, A. 2010. The economics of private equity funds. The Review of Financial Studies, 23(6):2303–2341.
Schaub, N. and Schmid, M. 2013. Hedge fund liquidity and performance: Evidence from the financial crisis. Journal of Banking & Finance, 37(3):671–692.
Terhaar, K., Staub, R., & Singer, B. D. (2003). Appropriate policy allocation for alternative investments. The Journal of Portfolio Management, 29(3), 101-110.