The views expressed in this manuscript are those of the authors and do not necessarily reflect the views of the Bank of Italy. Any errors and omissions are the sole responsibility of the authors.
We introduce a new model that allows to track secular trends and cyclical features of the predictive density of GDP growth. A substantial increase in downside risk to US economic growth emerges over the last 30 years, associated with the long-run growth slowdown of the early 2000s. Conditional skewness moves in a procyclical fashion, implying negatively skewed predictive distributions ahead and during recessions, often anticipated by the deterioration of financial conditions. On the other hand, positively skewed densities characterize expansions. When applied to the Euro Area, we recover similar features, and we document that downside risk to growth has remained particularly pronounced since the Sovereign Debt Crisis. The modeling framework ensures robustness to tail events and delivers competitive out-of-sample (point, density and tail) forecasts, improving upon standard benchmarks. We highlight that the asymmetry underlying economic growth fluctuations bears important information for the assessment of the balance of risk around central scenarios and it can provide valuable policy guidance.
Introduction
The sharp contraction, and the subsequent rebound from the pandemic recession, provided a sound reminder of the importance of accounting for tail events when assessing macroeconomic risk. However, assessing the degree of asymmetry of business cycle fluctuations remains a challenging task, and even more so it is to reliably gauge the time variation of downside risk. Policy makers pursuing a prudent, ‘plan for the worst, hope for the best’ approach are, now more than ever, weighing the uncertainty around central scenario forecasts. In fact, appropriately assessing the balance of risk around the models’ forecasts is critical to identifying signs of vulnerability to the economic recovery. In addition, economic policy should isolate the impact of short-term fluctuations, bounded to fade out quickly, and changes in secular trends, that can constrain the economy for longer periods. In our recent contribution, Delle Monache et al. (2021), we introduce a generalised, comprehensive framework able to provide policy guidance on the developments of downside risks to economic growth, based on secular movement and cyclical variations of business cycle fluctuations. Specifically, we track the time variation of the first three moments of the conditional distribution of GDP growth: mean, variance and skewness. The latter is a measure of the asymmetry of the conditional distribution, and provides a clear signal of the direction and magnitude of departures from the symmetric case. When skewness is negative, the balance of risk is tilted towards negative outcomes and downside risks dominates over the upside. For each of the moments we disentangle the effect of cyclical variations and permanent shifts in order to equip policy makers with a clear overview of the current state of the economy. We further relate transitory fluctuations to developments in the financial markets, measured by the Chicago FED’s National Financial Condition Index (NFCI), and its four subcomponents relating to risk, credit conditions, and leverage and nonfinancial leverage cycles.
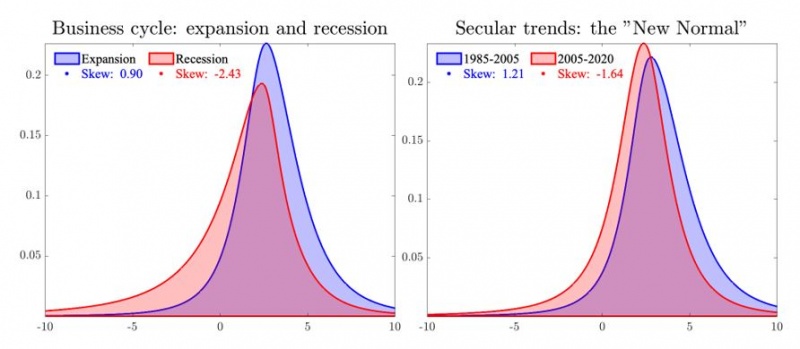
Note: The plots report model implied densities for two distinct cases. In the left panel we report the historical densities for periods of expansions, in blue, and recessions are in red. In the right panel we report the shift in the long-run growth distribution.
We provide novel evidence in support of the presence of conditional asymmetry of GDP growth’s distribution, suggesting that downside risk to economic growth exhibits significant variation over time. Over the last 50 years, the conditional distribution of GDP growth has been characterized by procyclical skewness fluctuations. At the onset of downturns, business cycle swings exhibit significant negative skewness, while expansions are marked by positively skewed distributions, as illustrated in the left panel of Figure 1. Despite the two densities being roughly centered around the same long-term growth level of 2.5%, the increase in downside risk, which is typical of recessions, gives rise to a substantially negative skewness of -2.4, compared to a value of 0.9 during expansionary phases. Over the long-run, we recover a significant downward trend in the skewness of GDP growth. This steady decrease in skewness observed over the last three decades implies a higher exposure to downside risk, and partially accounts for the slowdown in long-run growth observed since the early 2000s (see, e.g., Antonlin-Diaz et al., 2017). The right panel of Figure 1 shows that the “new normal” is characterized by higher risks towards the downside. The slow growth of the last 10 years is mainly due to the increasing vulnerability of the economy. Moreover, we document that financial indicators closely tracking the state of credit conditions and excess debt accumulation, can provide a reliable signal of increasing vulnerability. While in Delle Monache et al. (2021) we focus on US data, in this note we further highlight that downside risk shows similar patterns across the Atlantic.
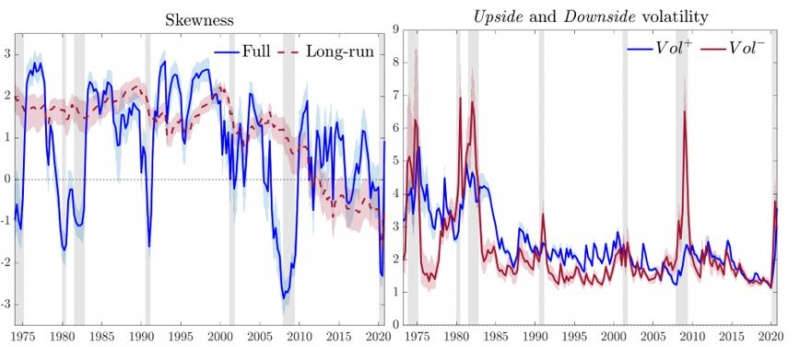
Figure 2 Time-varying downside risk
Time-varying downside risk and asymmetric growth
Classical policy tools often rely on the restrictive assumption of symmetric innovations hitting the economy. Our model extends these traditional approaches by allowing for the presence of asymmetry in the conditional distribution of economic growth, without imposing this as an “a priori” feature of the data. The skewness of the conditional distribution, reported in the right panel of Figure 2, evolves in a clear procyclical pattern. Recessions are characterized by substantially negative skewness, whereas expansions are marked by positively skewed distributions. Interestingly, skewness tends to decrease in anticipation of recessions, a feature which we show to be related to the information contained in the financial indicators, suggesting that downside risk dominates ahead of, and during downturns (see, e.g., Adrian et al., 2019). Specifically, the slow building up of leverage, as well as sudden movements in risk indicators, emerge as key determinants of the time variation of skewness.
In the right panel of Figure 2, we decompose GDP growth’s volatility into “upside” and “downside” components:
![]()
where μt denotes the time-varying mode of the conditional distribution. We document that the countercyclical behaviour of aggregate volatility (see, e.g., Jurado et al., 2015) reflects countercyclical downside risk; downside volatility spikes during recessions, whereas upside volatility displays only modest (pro-)cyclicality. Whereas the financial crisis of 2007-2008 appears as an episode of purely downside risk, the more recent Covid-recession is characterized by a spike in downside volatility occurred in the first half of 2020, quickly receding in favor of upside volatility in the second half. Moreover, the model recovers the well-established cyclical behavior of the mean of GDP growth, which displays sharp contractions during recessions. Over the long-run, skewness displays a downward trend starting in the late 1980s and falling markedly in the post-2000 sample. As a result, business cycle fluctuations are characterized by decreasing, but positive, trend-skewness until the onset of the financial crisis in 2007.
In the aftermath of the subsequent recession, this long-term trend turns to negative values, implying negatively skewed long-run conditional distributions. This signals the build-up of vulnerabilities, resulting in the economy being increasingly exposed to downside risk episodes. In turn, upside volatility features a steep decline starting in the mid-1980s, with small cyclical variations. On the other hand, downside volatility has remained stable over the same period. This highlights that the Great Moderation (see, e.g., McConnel and Perez-Quiros et al., 2000) is associated with a reduction of upside risks that is not being matched by an equal reduction of downside risks, as argued by Jensen et al. (2020).
Out-of-sample evaluation
We establish the importance of taking into account the time variation of downside risk and of monitoring indicators of financial distress to anticipate vulnerabilities to economic growth within an out-of-sample forecasting exercise spanning the 1980-2020 sample. We evaluate the accuracy of one-quarter- and one-year-ahead forecast considering not only point predictions, but also the uncertainty surrounding these predictions. In particular, we pose emphasis on evaluating the ability of the model to correctly characterize macroeconomic downside and tail risks.
When compared to a Gaussian benchmark, our model delivers substantial gains in terms of point, density and tail predictions. This suggests that capturing fat tails and time-varying skewness improves the forecast accuracy of the conditional distribution of GDP growth. When we add financial predictors to the model, (i.e. our baseline model specification), predictive scores are further enhanced, with the largest improvements clustered around recessions. Specifically, the build-up of financial and household leverage, as well as prompt jumps in credit spreads, provide strong predictive signals for the evolution of downside risk. Overall, we document up to 25% (35%) gains in point forecast, and 12% (23%) improvements in predicting downside risk episodes, respectively, for the one-quarter (one-year) ahead forecasts. Gains become even larger if one focuses on the post-2000s sample, or only considers recessions. The model outperforms competitive benchmark models also in terms of tail risk forecasts. Compared to the Gaussian model and the Skew-t specification without predictors, the baseline model achieves gains of up to 30% in timing the occurrence of future recessions, measured by means of the Brier score.
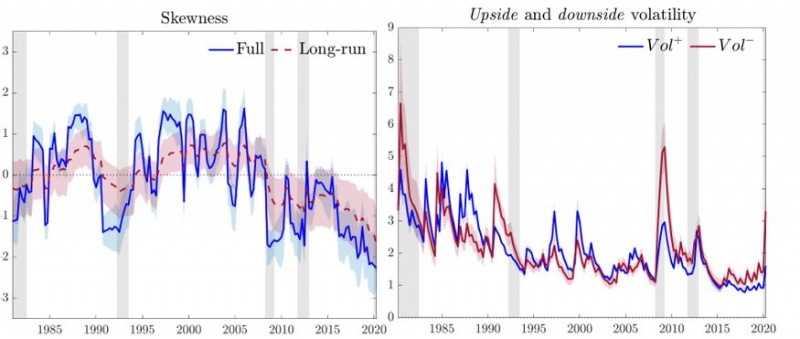
Figure 3 Time-varying downside risk in the Euro Area
Evidence for the Euro Area
Looking at the Euro Area (EA) business cycle, recessions are characterized by deepening negative skewness, and spikes of downside volatility, which overcomes its upside counterpart.1 Increases in downside risk anticipate recessions, highlighting that economic vulnerability is often visible ahead of contractions. The build-up of risk to the EA economy prior to the 1992-1993 recession should not surprise: the financial unrest associated with the European Monetary System, and the contraction of the US economy in 1991 were at the root of the clear fall in GDP growth skewness. Similarly, skewness plummets just prior to the Great Financial Crisis. However, contrary to the US, negative asymmetry persists, highlighting a substantial exposure to downside risk which accompanied the EA into the European Debt Crisis, and has remained elevated ever since.
Conclusions
Our findings draw attention to the paramount importance of considering the evolution of downside risk. This provides a reliable and interpretable signal for policy makers called to assess the balance of risk around central scenario projections. Currently, both the US and EA economies are rebounding strongly from the contraction associated with the pandemic. However, our estimates indicate that substantial downside risks and serious vulnerabilities still threaten the path to a full and sound recovery. Therefore, policy makers should be cautious of withdrawing the existing support too prematurely. ∎
Adrian, T., Boyarchenko, N. and Giannone, D., 2019. Vulnerable growth. American Economic Review, 109(4), pp.1263-89.
Antolin-Diaz, J., Drechsel, T. and Petrella, I., 2017. Tracking the slowdown in long-run GDP growth. Review of Eco-nomics and Statistics, 99(2), pp.343-356.
Delle Monache, D., De Polis, A. and Petrella, I., 2021. Modeling and forecasting macroeconomic downside risk. Bank of Italy Temi di Discussione (Working Paper) No, 1324.
Jensen, H., Petrella, I., Ravn, S.H. and Santoro, E., 2020. Leverage and deepening business-cycle skew-ness. American Economic Journal: Macroeconomics, 12(1), pp.245-81.
Jurado, K., Ludvigson, S.C. and Ng, S., 2015. Measuring uncertainty. American Economic Review, 105(3), pp.1177-1216.
McConnell, M.M. and Perez-Quiros, G., 2000. Output fluctuations in the United States: What has changed since the early 1980’s?. American Economic Review, 90(5), pp.1464-1476.