COVID-19 pandemic had a devastating effect on both lives and livelihoods in 2020. The arrival of effective vaccines can be a major game changer. However, vaccines are in short supply as of early 2021 and most of them are reserved for the advanced economies. We show that the global GDP loss of not inoculating all the countries, relative to a counterfactual of global vaccinations, can be higher than the cost of manufacturing and distributing vaccines globally. We use an economic-epidemiological framework that combines a SIR model with international production and trade networks. Based on this framework, we estimate the costs for 65 countries and 35 sectors. Our estimates suggest that up to 49 percent of the global economic costs of the pandemic in 2021 are borne by the advanced economies even if they achieve universal vaccination in their own countries.
Rolling out a vaccine to stop the spread of a global pandemic doesn’t come cheap. Billions of dollars have been spent developing drugs and putting in place a program to get those drugs into people’s arms. But amid an uneven distribution of vaccines – with poorer countries lagging far behind richer nations – another concern presents itself: the economic cost of not vaccinating everyone.
We sought to find out what the total hit to the global economy of uneven vaccination distribution might be. Our results published as a working paper by the National Bureau of Economic Research and the Center for Economic Policy Research, and were presented at World Health Organization press briefing lead by Dr. Tedros on January 26, 2021.
To do so, we analyzed 35 industries – such as services and manufacturing – in 65 countries and examined how they were all linked economically in 2019, before the pandemic. For example, the construction sector in the U.S. relies on steel imported from Brazil, American auto manufacturers need glass and tires that come from countries in Asia, and so forth. We then used data on COVID-19 infections for each country to demonstrate if coronavirus crisis were to disrupt global trade, curbing shipments of steel, glass and other exports to other countries, all countries lose. The more that a sector relies on people working in close proximity to produce goods, the more disruption there will be for that sector due to higher infections.
Our results showed that if wealthier nations are fully vaccinated by the middle of this year – a goal that many countries are striving for – yet developing countries manage to vaccinate only half of their populations, the global economic loss would amount to around US$4 trillion and the U.S., Canada, Europe and Japan would shoulder almost half this burden.
Our research underscores that no economy is an island and it is in rich countries’ direct economic interest to ensure poor nations are fully vaccinated as well. Widespread vaccinations in wealthier nations will certainly help domestic businesses like restaurants, gyms and other services. But, industries such as auto, construction and retail that depend on outside countries for materials, parts and supplies will continue to suffer if vaccines are not made available worldwide. A full global economic recovery will come only when every economy recovers from the pandemic. We already have a glimpse of this scenario during first quarter of 2021 with the uneven recoveries in the world.
It is primarily a humanitarian responsibility to produce and distribute vaccines to the whole world. Our results also highlight that this is not an act of charity but an act of economic rationality from the perspective of advanced economies.
Figure 1: International Trade Linkages
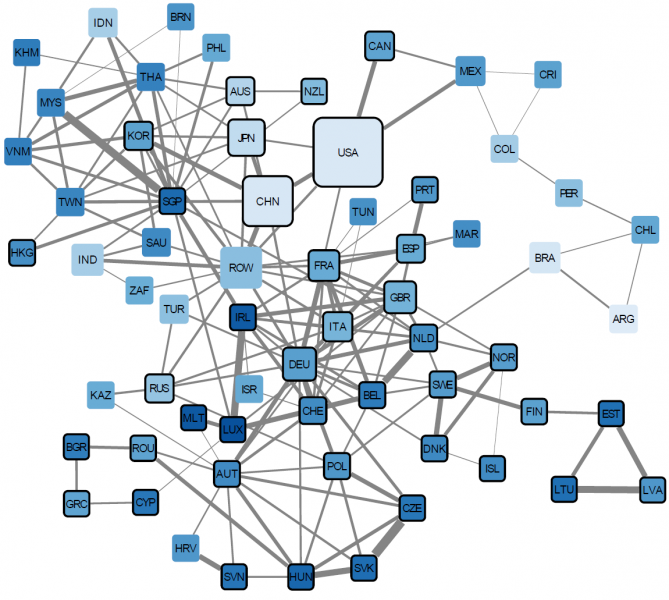
Notes: In this network, we show a summary of international linkages. Each node corresponds to a country, with the node sizes proportional to the GDP of the country. The node color represents the openness of the country where openness is defined as the ratio of imports and exports to GDP. The vaccinated countries are denoted by black borders. We show the trade linkages as lines between nodes. The line gets thicker as the ratio of trade to GDP increases. In total, there are 65 nodes and 168 lines shown on the network. The trade values, openness calculations, and the GDP values are all based on OECD (2020) Tables.
Figure 2: Inter-industry Trade Linkages
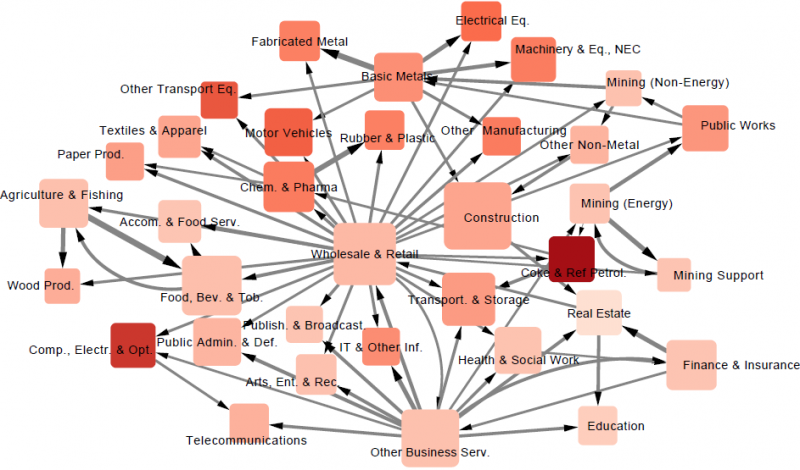
Notes: In this network, we show aggregated inter-industry linkages. Each node corresponds to an industry. The node size represents the total intermediate usage of the industry. The smallest node corresponds to 184 billion USD for Mining Support industry and the largest node corresponds to 5.9 trillion USD in Construction industry. The node color represents the share of imported inputs in the industry. The lightest shade represents 5.9% in Real Estate industry and the darkest shade represents 37% in the Coke & Refined Petroleum industry. We show the trade linkages from the supply industry to the target industry with directed lines. The thickness of the lines show the strength of the relation based on: (i) the intermediate input from the supply industry constitutes at least 10 percent of the inputs of target industry; or (ii) the supply industry is among the top two suppliers of the target industry. In total, there are 35 nodes and 72 lines shown on the network. Inter industry linkages are based on OECD (2020) Tables.
Figure 3: Relative Decline if GDP due to Domestic Costs (% GDP)
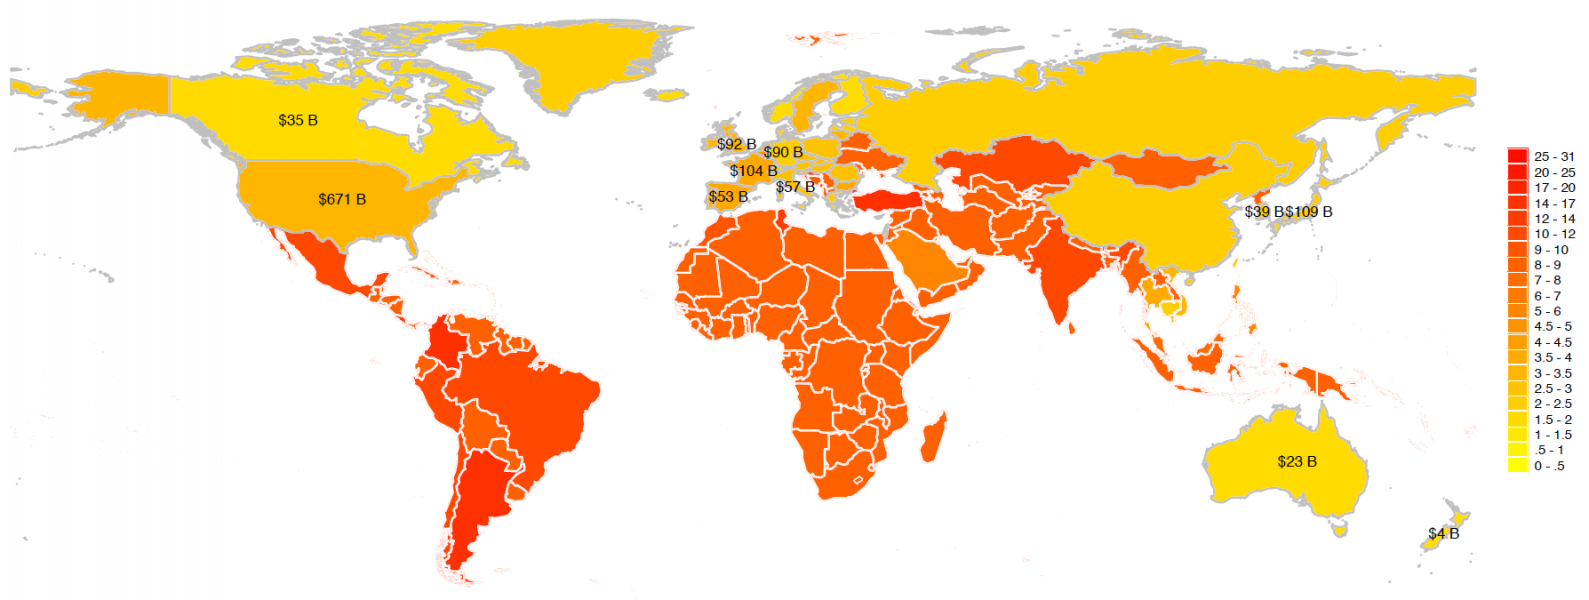
Notes: This figure illustrates the domestic shocks under specification 3 of scenario 3. Here, we eliminated all the shocks associated with the pandemic except within a given country. We run our simulations for 65 countries separately. The shades of yellow correspond to relatively lower ratios and the shades of red correspond to higher relative losses. Vaccinated countries are highlighted with light gray borders. GDP loss values are shown on the map for selected countries.
Reference
Cem Çakmaklı & Selva Demiralp & Ṣebnem Kalemli-Özcan & Sevcan Yeşiltaş & Muhammed A. Yıldırım, 2021. “The Economic Case for Global Vaccinations: An Epidemiological Model with International Production Networks,” NBER Working Papers 28395, National Bureau of Economic Research, Inc.