The views, opinions, findings, and conclusions or recommendations expressed in this policy brief are strictly those of the authors. They do not necessarily reflect the views of the Swiss National Bank (SNB). The SNB takes no responsibility for any errors or omissions in, or for the correctness of, the information contained in this policy brief.
We examine the economic impact of Russia’s invasion of Ukraine on Germany, the UK, France, Italy and Switzerland using data on historical geopolitical events. Employing a structural VAR approach based on zero, sign and narrative sign restrictions, our analysis reveals a drag on real economic activity and a considerable increase in inflation due to the war. In a counterfactual scenario without the invasion, we find a more substantial impact on inflation compared to economic activity. In the absence of the conflict, CPI inflation in European countries would have been 0.7 to 2.4 percentage points lower in 2022Q4, and GDP would have been between 0.3 and 1.8 percent higher.
Russia’s war on Ukraine has unleashed immense human suffering, leaving countless lives lost and many displaced. In light of this human catastrophe, economic consequences are certainly secondary. Nevertheless, they appear to have been substantial. The onset of Russia’s war on Ukraine has triggered a surge in energy prices, financial market turmoil, and raised serious economic concerns, particularly for European economies due to their dependence on Russian gas. In a recently published SNB Working Paper, we quantify the economic impact of Russia’s invasion of Ukraine on Germany, the UK, France, Italy and Switzerland. This note summarizes the main findings of the updated SNB Working Paper.
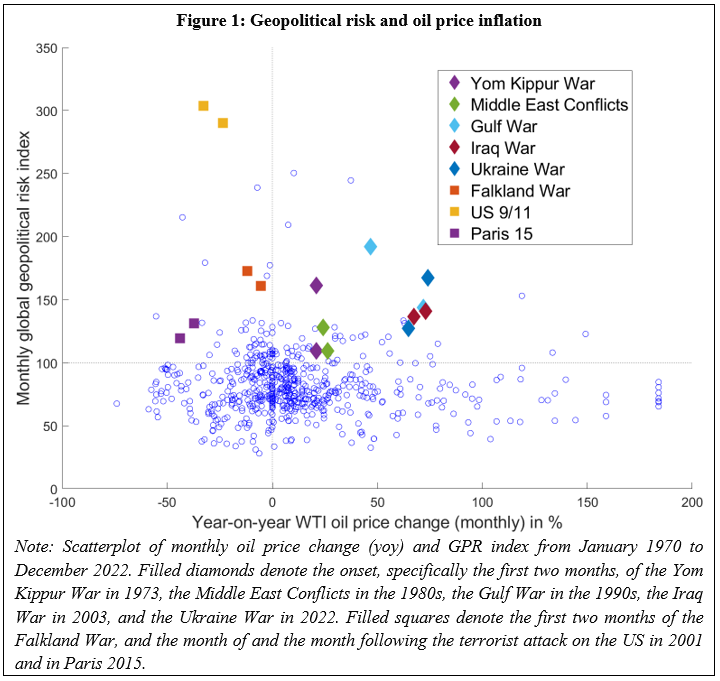
To quantify the economic impact of Russia’s invasion of Ukraine, we analyze historical geopolitical conflicts that, from an economic perspective, are similar to Russia’s war on Ukraine. Specifically, we label geopolitical conflicts as similar when they are associated with fears of disruption or actual disruptions of energy supply. To identify such conflicts, we consider episodes that are characterized by (i) heightened geopolitical risk, as measured by Caldara and Iacoviello (2022)’s newspaper-based geopolitical risk (GPR) index, and (ii) rising energy prices. Figure 1 illustrates our approach. It plots the GPR index against WTI oil price inflation. The GPR index is meant to capture the extent of geopolitical tension, where a value of 100 reflects the historical average. The geopolitical conflicts of our interest are shown in the top right quadrant, including the Yom Kippur War (1973), the conflicts in the Middle East (1980s), the Gulf War (1990s) or the Iraq War (2003). These major geopolitical conflicts are associated with energy supply disruptions and were accompanied by sharply rising oil price inflation when they broke out (Figure 1, diamonds). Conversely, the chart also shows that there are many geopolitical events not associated with energy supply concerns such as the Falkland War of 1982, the terrorist attacks on the US in 2001, or the 2015 Paris attacks, which are shown in the upper left quadrant (Figure 1, squares).
To exploit the information of historical geopolitical conflicts similar to the war in Ukraine, we employ a structural vector autoregression (VAR) approach, combining zero, sign (Uhlig, 2005), and narrative sign (Kilian and Murphy, 2014, Antolin-Diaz and Rubio-Ramirez, 2018) restrictions. We compute a separate VAR for each of our five countries of interest over the period 1973Q1-2022Q4. Each VAR contains a common global part and a country-specific local part. The global part includes data on the historical GPR index of Caldara and Iacoviello (2022), world GDP, world inflation, world consumer sentiment, oil price inflation, US short-term interest rates, and non-energy and non-military US industrial production. The local part includes data on country-specific GDP, energy and aggregate inflation, consumer sentiment and short-term interest rates. We assume that the global part is block exogenous to the rest, which allows us to differentiate between global and local effects.
To quantify the impact of geopolitical conflicts associated with energy supply concerns, we identify conflict shocks using the following restrictions. First, we assume that the conflict shock increases the GPR index and oil prices, while weighing on non-energy and non-military US industrial production. Second, we impose that at the outbreak of the Yom Kippur War (1973), the Middle East conflicts (1980s), the Gulf War (1990s), the Iraq War (2003), and the Ukraine War (2022), the conflict shock was positive. We believe that the distinction between conflicts that are associated with energy supply concerns and those that are not is crucial, as different transmission mechanisms are likely at play. Various articles in the literature (e.g., Pinchetti, 2024) and our own calculations support this assumption.
In contrast to most historical geopolitical conflicts in our sample, Europe has been particularly strongly affected by Russia’s invasion of Ukraine, especially due to Russia’s key role in Europe’s energy supply. Following the inva-sion, gas prices in the euro area rose much more sharply compared to other regions of the world. At times in 2022, they were around four times higher than at the beginning of February before the invasion. US gas prices, for example, “only” reached peaks that were around twice as high as at the beginning of February. Additionally, the share of gas in total energy consumption before the war was high in Europe, higher than in the rest of the world. In 2021, it amounted to 34% compared to a global share of 25%. Among the European countries consid-ered in our study, Italy and the UK stand out in this regard with a gas share of 41% and 39%.
In order to account for the surge of energy prices in Europe, which went beyond what our conflict shocks imply, we additionally identify a country-specific energy supply shock. The country-specific energy supply shock is iden-tified solely within the local part of the VAR, and therefore only captures movements in domestic energy prices over and above those movements implied by the global part. It is identified based on the following restrictions. We impose that a country-specific energy supply shock raises domestic energy prices and weighs on domestic GDP. Additionally, we assume that all European countries considered in our study suffered such a country-specific energy supply shock at the beginning of Russia’s invasion of Ukraine.
Having set up a VAR model that is able to capture both, the influence of geopolitical conflicts associated with en-ergy supply concerns and the disproportionate exposure of Europe to Russia’s energy supply, we are now able to quantify the economic impact of Russia’s invasion of Ukraine. Our approach is to construct a counterfactual of the economic development if Russia did not attack Ukraine. To build such a counterfactual, we first estimate our VARs and identify the conflict and energy shocks. Consequently, we assume that the GPR index would have re-mained unchanged at the beginning of the war in Ukraine. We implement this by adjusting the conflict shock se-ries accordingly. This represents the counterfactual concerning the global conflict channel. Furthermore, we set the country-specific energy shocks to zero at the beginning of the war in Ukraine to account for the local energy supply channel. We then obtain the counterfactual economic development by simulating our VARs forward using these counterfactual shock series.
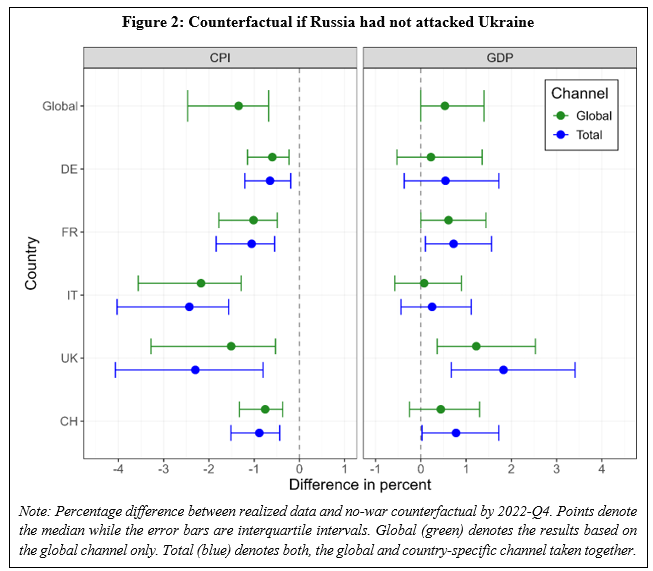
Figure 2 illustrates the main results of the counterfactual exercise and shows the percentage difference between the counterfactual and the realized path of GDP and inflation. The points denote the posterior median, and the error bars show the interquartile intervals. The green points and error bars illustrate the impact of the global conflict channel, whereas the same in blue depict the impact of the global conflict and country-specific energy supply channel together.
Without Russia’s war on Ukraine, the global economy would have been stronger. Counterfactual global GDP would be 0.5% higher by 2022Q4 than realized. This negative effect is, at least in part, due to lower oil prices and inflation, more optimistic consumer sentiment and higher industrial production excluding energy materials and military production. Global inflation would have been more than one percentage point lower by 2022Q4 if Russia had not attacked nor threatened Ukraine, mainly due to lower oil prices.
To assess the effects on the European economies, we need to differentiate between the global conflict and the country-specific energy supply channel as specified in the previous sections. If only the global conflict shock asso-ciated with supply concerns is restricted, i.e., assuming that the GPR index remained constant, we find a lower inflation rate in the counterfactual scenario. As shown by the green boxplots in the left panel of Figure 2, the counterfactual CPI level of all countries is significantly lower than its realized path by the end of 2022. This can be attributed, at least in part, to lower energy inflation in the counterfactual. Regarding the real economy, we find that in France and the UK, GDP is significantly higher in the counterfactual scenario (see green boxplots in the right panel of Figure 2). For the other countries, the impact is less precisely estimated but the posterior median counterfactual GDP is higher as well. One potential reason is the significantly higher consumer sentiment in the counterfactual scenarios.
As a next step, we incorporate the country-specific energy supply channel by setting the local energy shocks to zero. As the blue boxplots in the left panel of Figure 2 show, this further reduces CPI in the counterfactual. Again, this is at least partly due to lower energy inflation. Note that the stronger impact on inflation in Italy and the UK is probably also related to the fact that the share of gas in total energy consumption was almost twice as high as in the other countries at the beginning of the invasion. Accordingly, the soaring gas prices had a disproportionate impact on energy prices and therefore probably also on overall inflation in Italy and the UK. With respect to GDP, the inclusion of the country-specific channel increases the counterfactual path (see blue boxplots in the right pan-el of Figure 2). We can see that in all countries, GDP would have been higher without Russia’s attack, suggesting that the war noticeably affected the real economy as well. Due to the explicit or implicit energy price caps in the countries considered, the estimates for the local energy price channel are likely to represent a lower bound.
Drawing on insights from historical geopolitical conflicts, we find that Russia’s invasion of Ukraine has had considerable economic consequences for Germany, the UK, France, Italy, and Switzerland. Our counterfactual analysis suggests a more substantial impact on inflation compared to economic activity. In the absence of the conflict, CPI inflation in these countries would have been 0.7 to 2.4 percentage points lower in 2022Q4, and GDP would have been between 0.3 and 1.8 percent higher. It is worth noting that while we find a sizable impact of the war on inflation, other factors appear to have contributed to the global inflation surge in 2022. Further, as shown in our SNB Working Paper, the medium-to-long-terms effects on the real economy are anticipated to be more substantial than what we have experienced so far.
Antolin-Diaz, J. and Rubio-Ramirez, J. F. (2018). Narrative sign restrictions for SVARs.
American Economic Review, 108(10):2802–29.
Bruhin, J., Scheufele, R., and Stucki, Y. (2023). The economic impact of Russia’s invasion of Ukraine on European countries – a SVAR approach. Swiss National Bank Working Paper Series, 2023-04.
Caldara, D. and Iacoviello, M. (2022). Measuring geopolitical risk. American Economic Review, 112(4):1194–1225.
Kilian, L. and Murphy, D. P. (2014). The role of inventories and speculative trading in the global market for crude oil. Journalof Applied Econometrics, 29(3):454–478.
Pinchetti, M. (2024). Geopolitical Risk and Inflation: The Role of Energy Markets. Working Paper
Uhlig, H. (2005). What are the effects of monetary policy on output? Results from an agnosticidentification procedure. Journal of Monetary Economics, 52(2):381–419.