
This briefing investigates to what extent the introduction of negative monetary policy rates altered the competitive behaviour in the euro area banking sector. Specifically, it analyses the effect that negative policy rates had on euro area banks’ market power in comparison to banks that have not been subject to negative rates. The analysis finds that negative monetary policy rates led to an increase in euro area banks’ market power. Furthermore, it shows that, during the negative interest rate policy period, change in banks’ competitive behaviour affected the bank lending channel and discouraged banks from taking excessive risks.
To counter the severe recession and the deflationary pressures that arose during the Global Financial Crisis (GFC) and the sovereign debt crisis, policymakers launched an unprecedented accommodative monetary policy cycle. During this period, which lasted for about ten years, monetary policy rates reached the zero-lower bound (ZLB). In the euro area, the low interest rate environment reached a watershed in 2014 when the ECB adopted a negative interest rate policy (NIRP) and after several consecutive reductions lowered the Deposit Facility rate (DF) to as low as -0.50% in September 2019.
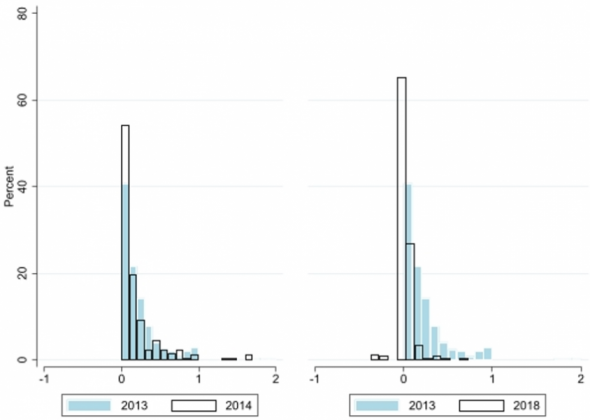
It can be argued that negative interest rates can lead to changes in the behaviour of banks in comparison to a positive interest rate environment. In particular, when policy rates enter negative territory, banks are generally reluctant to pass-through negative rates on deposit customers (see Figure 1) leading to increased stickiness of deposit rates.1 Furthermore, in response to NIRP, because of the compression on margins, banks are induced to adjust their sources of income, cost efficiency, investment choices and lending decisions.2 There are also good reasons to believe that when the level of interest rates is low banks tend to behave less aggressively as they have less to gain from undercutting their competitors.3 This is mainly driven by the deposit side as depositors’ “switching costs” (i.e., the opportunity cost of switching deposits from one bank to the other) increase when deposit rates approaches the ZLB.4 In other words, the market power of banks is altered when interest rates approach zero or even go below. These behavioural changes could in turn have monetary policy and financial stability implications.
Figure 1: Distribution of overnight household deposit rates across banks

Source: ECB IMIR Statistics and ECB calculations. Note: Percent scales the height of the bars so that the sum of their heights equals 100. X-axis is the bank deposit rate (p.a.).
In a recent paper we investigate empirically to what extent negative interest rates altered competitive conditions in the euro area banking sector and how this may have affected both the monetary policy transmission and bank stability. Specifically, we base our analysis on a panel dataset of 4,223 banks from 28 countries for the period between 2011 and 2018 and employing a difference-in-differences (DiD) estimator and we first examine the effects of NIRP on banks’ market power.5 Then we investigate how changes in market power affected lending behaviour and bank stability in the euro area after the introduction of the NIRP.
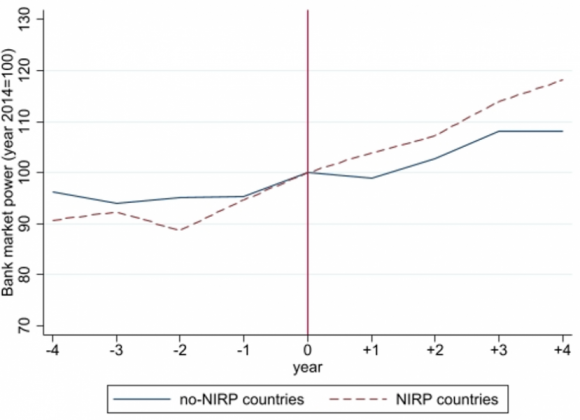
We first study the impact of the introduction of the NIRP on the market power of banks incorporated in the euro area countries (our “treatment group”) with respect to the market power of banks incorporated in countries that have not been subject to negative monetary policy rates (our “control group”). We find that the market power of euro area banks – as measured by the Lerner Index – increased in comparison to banks which are located in countries that did not adopt the NIRP (see Figure 2). Furthermore, we find that NIRP had a significant negative effect on both banks’ marginal returns and marginal costs. However, the effect on marginal costs was more material leading to an increase in banks’ mark-ups. Overall, this seems to confirm that negative policy rates altered banking sector competition in the euro area and that the main driver was coming from the liabilities side especially by increasing switching costs in deposit markets.6
Figure 2: Bank market power evolution pre- and post-NIRP period

Source: ECB calculations. Note: The figure shows the yearly evolution of the Lerner index (year 2014 = 100) for the treated banks (red dashed line) and non-treated banks (blue line). We calculate an index for each bank and plot the mean index for NIRP and no-NIRP affected banks. The vertical red line indicates the introduction of NIRP (year 0 = 2014).
Secondly, we investigate how these changes in market power affected lending behaviour and bank stability in the euro area after the introduction of the NIRP. Employing a DiD approach on a sample of euro area banks, we compare the lending behaviour and bank stability of euro area banks with different levels of market power before and after the ECB introduced its NIRP in 2014.
Considering first the question on monetary policy transmission during the NIRP period, we find evidence of the existence of the bank lending channel. This is evidenced by a statistically significant positive impact of monetary policy rate changes on loan growth, suggesting that monetary policy retained its effectiveness also during the period of negative interest rates. At the same time, we observe that, as banks’ market power increased during the NIRP period, the monetary policy transmission was somewhat dampened. Indeed, the lending of banks with higher market power tended to be less sensitive to changes in the monetary policy rate during the NIRP period.
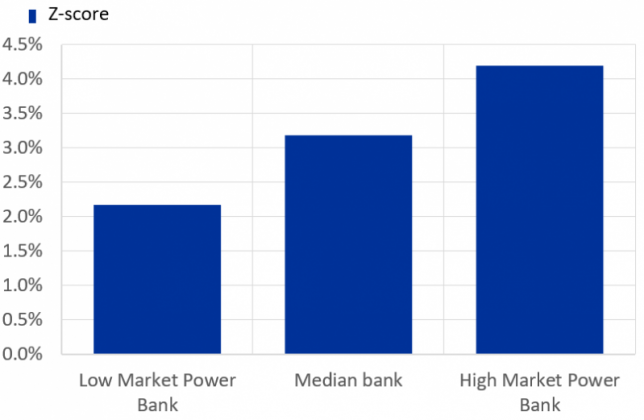
When exploring more in-depth the relationship between bank stability indicators7 and the Lerner Index before and after NIRP, we find that after negative interest rates were introduced, banks with higher market power reduced their overall risk (see Figure 3). This latter result is consistent with the “competition-fragility” view (see e.g., Allen and Gale (2004)), which suggests that an increase of market power, and as a corollary the increased mark-ups, would disincentivise banks from excessive risk taking.
Figure 3: Impact on the Z-score of market power during the NIRP period

Source: ECB calculations. Note: The chart displays the estimated direct impact on the Z-score (percentage) of market power during the NIRP period. The model for the Z-score is estimated on a panel with bank level yearly data for the euro area, over the period 2011-2018. It comprises standard bank-level indicators, bank and time fixed-effects. The depended variable is the bank Z-score. The Z-score indicates the distance from insolvency of bank i in country j at time t. Lerner index is a measure of banks’ market power, which ranges between 1 (monopoly) and 0 (perfect competition). Low, median and high market power banks are respectively those with a Lerner index lower than sample Q1, equal to the sample median level and higher than sample Q3.
Allen, F. and D. Gale (2004), “Competition and financial stability”, Journal of Money, Credit and Banking 36, 453–480.
Altavilla, C., M. Boucinha and J.-L. Peydro (2018), “Monetary Policy and Bank Profitability in a Low Interest Rate Environment”, Economic Policy 33, 531–586.
Altunbas, Y., G. Avignone, C. Kok, and C. Pancaro (2023), “Euro Area Banks’ Market Power, Lending Channel and Stability: The Effects of Negative Policy Rates,” ECB Working Paper Series, No. 2790.
Avignone, G., C. Girardone, C. Pancaro, L. Pancotto, and A. Reghezza (2022), “Making a Virtue out of Necessity: the Effect of Negative Interest Rates on Bank Cost Efficiency”, ECB Working Paper Series, No. 2718.
Bagliano, F. C., A. Dalmazzo and G. Marini (2000), “Bank Competition and ECB’s Monetary Policy”, Journal of Banking and Finance 24, 967–983.
Brunnermeier, M. and Y. Koby (2018), “The Reversal Interest Rate”, NBER Working Paper 25406.
Bubeck, J., A. Maddaloni and J.-L. Peydro (2020), “Negative Monetary Policy Rates and Systemic Banks’ Risk-Taking: Evidence from the Euro Area Securities Register”, Journal of Money, Credit and Banking 52, 197–231.
Darracq Pariès, M., C. Kok and M. Rottner (2020), “Reversal Interest Rate and Macroprudential policy”, ECB Working Paper, No. 2487.
Eggertsson, G., R. Juelsrud, L. Summers and E. Wold (2019), “Negative Nominal Interest Rates and the Bank Lending Channel”, NBER Working Paper 25416.
Gropp, R., C. Kok and J. Lichtenberger (2014), “The Dynamics of Bank Spreads and Financial Structure”, The Quarterly Journal of Finance 4.
Heider, F., F. Saidi and G. Schepens (2019), “Life below Zero: Bank Lending under Negative Policy Rates”, The Review of Financial Studies 32, 3728–3761.
Levieuge, G. and J.-G. Sahuc (2021), “Downward Interest Rate Rigidity”, European Economic Review 137.
See, e.g., Heider, Saidi and Schepens (2019).
See, e.g., Altavilla, Boucinha and Peydro (2018), Avignone, Girardone, Pancaro, Pancotto, Reghezza (2022) and Bubeck, Maddaloni and Peydro (2020).
See, e.g., Bagliano, Dalmazzo and Marini (2000).
See, e.g., Brunnermeier and Koby (2018) and Darracq Pariès, Kok and Rottner (2020).
We use the Lerner index as a direct measure of market power. The Lerner index is defined as the difference between banks’ marginal returns and marginal costs.
This finding is consistent with empirical results of Gropp, Kok and Lichtenberger (2014) and Levieuge and Sahuc (2021) who provide evidence of the downward rigidity of bank lending rates. They argue that banks tend to adjust their lending rates more slowly and less completely to decreases in short-term market rates than to increases. This rigidity is amplified when policy rates are close to their effective lower bound or if banks’ profitability deteriorates, as argued by Brunnermeier and Koby (2018) and Eggertsson, Juelsrud, Summers and Wold (2019).
As bank stability indicators we use both the Z-score and the risk-adjusted return on assets. The Z-score indicates the distance from default of individual banks measured by the number of standard deviations that bank profitability has to fall for the bank to become insolvent. The risk-adjusted return on assets is measured by the ratio of return on assets and its own volatility.