Prepared by F. Babbi, I. Frieden and M. Scheicher (ECB/SSM, Directorate-General Horizontal Line Supervision). The opinions in this paper do not necessarily reflect those of the ECB, the SSM or the Eurosystem. Discussions with Darrell Duffie are gratefully acknowledged.
Interest rate swaps (IRS) are used by banks and other market participants to hedge and trade interest rate risk. At the current juncture, there are three motivations for analysis of IRS trading. First, IRS provide a vital instrument in the current monetary policy environment. To manage interest rate risk market participants such as banks with fixed-rate mortgage books are relying on solid IRS market liquidity. Second, at around US$ 414 trillion of global outstanding notional,1 IRS represent the largest segment of the global derivatives market, with EUR-denominated IRS accounting for around 25%. As IRS are traded via a core group of Dealer banks, analysis of IRS trading provides a unique perspective into the mechanics of intermediation in a major fixed income instrument. Third, Brexit has led to a substantial overhaul of the EU infrastructure for trading and clearing IRS.2 In this SUERF Brief, we analyse trading activity and market liquidity in the most active EUR-denominated IRS contract from 2018 to late 2022. We observe that trading in long-dated Euribor swaps has been active over the last four years with a further increase in 2022. Recently, price-based measures have been indicating a possible deterioration in trading conditions, similar to trends in measures for global fixed income market liquidity.
An IRS is a contractual agreement to periodically exchange fixed-rate payments for an agreed maturity and on a specified notional for a stream of payments, which is calculated by using a floating rate of interest (“fixed-for-floating IRS”). The European Market Infrastructure Regulation (EMIR), which was launched in 2012, requires electronic trading and central clearing for most IRS transactions denominated in EUR, thereby significantly reducing counterparty risk in the derivatives market. In parallel, detailed data on IRS transactions have become available to supervisors and central banks via Trade Repositories. Trading of swaps takes place in a decentralised “over-the-counter” (OTC) market structure and relies on the market making of large banks who continuously match IRS buyers and sellers. The core of this market consists of a small group of Dealers (typically large globally active banks3), which trade IRS with other Dealers (“Dealer-Dealer segment”), many other banks as well as non-banks such as asset managers (“Dealer-Client segment”), sometimes using their balance sheets to warehouse exposures. Standard swap contracts are typically traded on electronic platforms.4 Partly due to the high share of electronic trading, most swap transactions are cleared in Central Counterparties (CCPs).5 In the first half of 2022 almost 80% of EUR IRS passed through CCPs (BIS, 2022). This active use of central clearing has increased the importance of the shock-absorbing capacity of CCPs. For maturities above one year, Euro area banks are particularly active in IRS referencing Euribor.6 Euro area banks (for example firms facing fixed rate cashflows from their mortgage books) typically buy floating rate payments, hedging the risk from their fixed-rate loan books.7 Swaps on the Euribor 6-Month rate with a 10-year maturity are among the most actively used instruments. We will analyse pricing, activity and trading conditions of this contract in detail in the following three sections (based on a sample of transactions covering the period from January 2018 to November 2022).8
In our sample period, pricing of the Euribor swap contracts reflects two distinct periods of inflation and corresponding monetary policy (highlighted by vertical bars in Chart 1):
Chart 1: Swap rate rising since late 2021
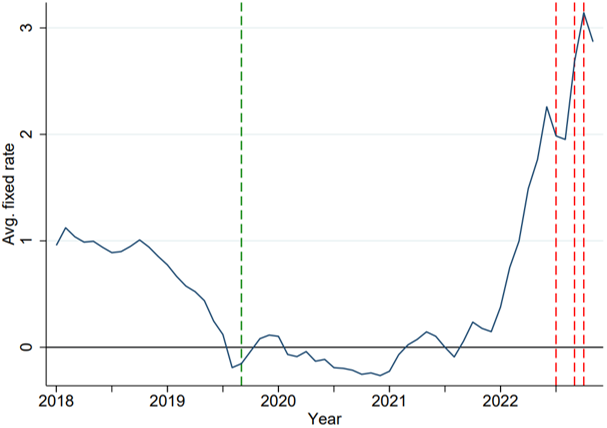
Note: Monthly aggregation; Red (green) vertical lines represent ECB monetary policy tightening (loosening). Source: EMIR Trade Repositories; Authors’ calculations.
Since 2021 activity in Euribor-denominated IRS has increased, reflecting a broader trend in IRS overall (BIS, 2022). An indication is provided by the growth in notional volume (Chart 2, first row).10 A decomposition of the volume shows that the overall growth is driven by larger average trade size and increasing participation in swap trading (Chart 2, second row).
Daily average notional volume in the last month of our sample (November 2022) is around EUR 20 bn based on more than 370 trades newly executed per day in that month. Average trade size was EUR 54 mn. 54 traders were active on average during November 2022. In contrast, in the low rates period of July 2020 average daily notional volume amounted to only EUR 6.8 bn with slightly less than 180 trades executed per day by around 35 market participants. Particularly strong market activity has been observed on a few days starting in late 2021 and continuing until the end of our sample, when 60 or more Clearing Members were active in this contract. The number of active banks provides an indication of market’s depth, namely that the EUR swap market is deeper than US corporate bond trading but less deep than trading of benchmark US Treasuries.11
Smooth trading of swaps depends on the availability and robustness of market liquidity (cf. Adrian et al., 2018). Market liquidity is usually understood as the ease with which a trader can buy or sell an instrument at a price close to the observed market price prior to the current transaction. During extreme stress, a dislocation leads to a breakdown of trading and investors withdrawing from the market or being unable to adjust their positions to changes in economic fundamentals. Given the benchmark function of IRS, liquidity stress in swaps might also influence conditions in other fixed income segments.
The high activity illustrated above is one condition for banks and other traders to quickly adjust their positions. OTC markets lack centralised dissemination of transactions and quotes. Investors therefore face opacity when entering a new trade. Less sophisticated and less active investors are unable to check if the conditions offered by their Dealer are close to currently prevailing market prices. Hence, as a second set of drivers of market liquidity we now analyse the empirical behaviour of the prices of individual transactions during a trading day. In this context, key factors influencing market liquidity are the direct transaction costs (e.g. the bid-ask spread between the prices faced by buyers and sellers of the same instrument at the same time) and the price impact of new trades (e.g. reaction of prices to reasonably sized orders). From a bank perspective, smooth market liquidity allows for quick hedging at reasonable cost (low bid-ask spreads and modest price impact of individual trades), thereby stabilising their funding costs.
Given that the empirical literature offers a wide range of liquidity measures, we calculate two complementary metrics:
Our empirical results are summarised in Chart 3. Levels of both variables are stable from the start of our sample until late 2021, when pricing dispersion rises. Both series rise in a similar manner, which indicates a broader change in market conditions. A temporary peak is also observed in early 2020 when the Covid shock hit global financial markets.
Chart 2: Growing activity since late 2021
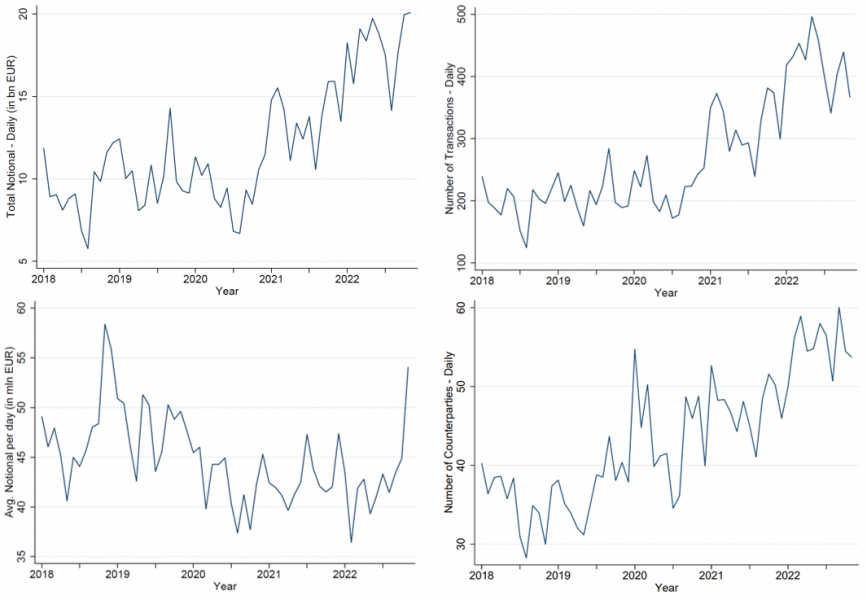
Note: Monthly averages of daily values; Source: EMIR Trade Repositories; Authors’ calculations.
A comparison with trading conditions in the world’s largest government bond market, US Treasuries, shows similar patterns, with a deterioration indicated since 2021 (Chart 3).13 Such patterns are not surprising, as market participants had to process a lot of new information related to the geopolitical environment, the macroeconomy and monetary policy. The general fragility of market liquidity in fixed income markets (cf. FSB, 2022) has been highlighted by the dislocation in US fixed income markets in March 2020 (first spike in the price dispersion of US Treasuries in Chart 3)14 and more recently by stress in UK Gilt trading in September 2022, due to a surprise change in fiscal policy.
Monitoring IRS activity and liquidity is critical for central banks as both directly affect the ability of banks to deal with the currently volatile interest rate environment. Interpretation of the evolution of market liquidity must take into consideration the effects of both demand for market liquidity (driven by banks and asset managers who react to interest rate changes, bank risk appetite and overall demand for hedging) and supply provided by Dealers (whose intermediation capacity is driven e.g. by their capital situation; cf. Duffie (2018)). The empirical analysis of these drivers, including separating the monetary policy changes from structural drivers, is the topic of our current research. In this context, a comparison of the broad range of liquidity indicators is also an element of our empirical research.
Chart 3: Price-based measures indicating deteriorating trading conditions
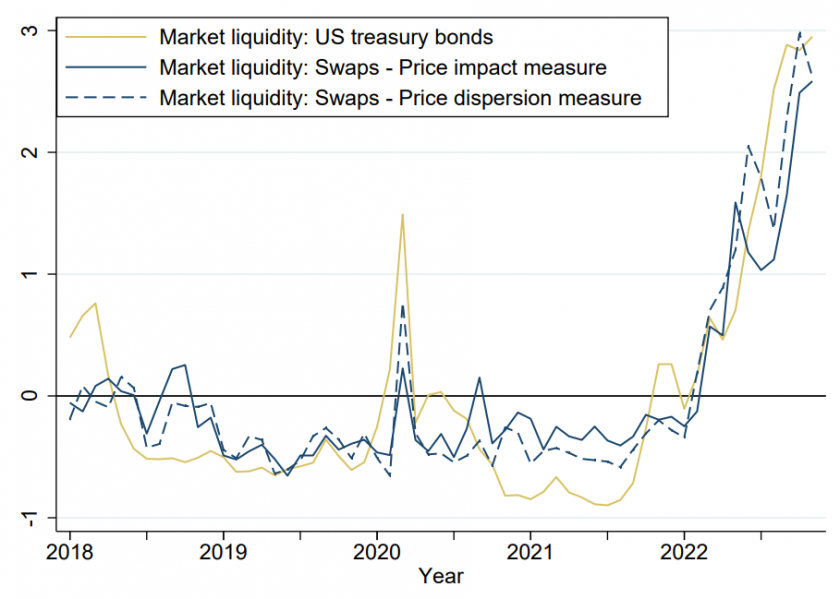
Note: This figure shows the evolution of three market liquidity measures between 2018 and the end of 2022. Two measures (Price dispersion and price impact measure) illustrate market liquidity in the interest rate swap market (new trades in Euribor 6M – 10 year maturity swaps per business day). The third measure is a liquidity index for US Treasury government bonds. All measures are standardised, monthly averaged daily aggregations. Source: EMIR Trade Repositories; Authors’ calculations; Bloomberg.
Tobias Adrian, John Kiff, and Hyungson Shin (2018), “Liquidity, Leverage, and Regulation 10 Years After the Global Financial Crisis”, Annual Review of Financial Economics, 10, November 2018, pp. 1-24.
Yakov Amihud (2002) “Illiquidity and stock returns: cross-section and time-series effects”, Journal of Financial Markets 5: 31–56.
Evangelos Benos, Richard G. Payne, and Michalis Vasios (2018) Centralized Trading, Transparency and Interest Rate Swap Market Liquidity: Evidence from the Implementation of the Dodd-Frank Act. Bank of England Working Paper No. 580.
BIS (2022), “OTC Derivatives Statistics” 30 November 2022 https://stats.bis.org/statx/srs/table/d7
Silvia Dalla Fontana, Marco Holz auf der Heide, Loriana Pelizzon and Martin Scheicher (2019) “The Anatomy of the Euro Area Interest Rate Swap Market.” ECB Working Paper No. 2242.
Darrell Duffie (2018), “Post-Crisis Bank Regulations and Financial Market Liquidity”, Baffi Lecture.
European Commission (2022) “Press release”; https://finance.ec.europa.eu/publications/capital-markets-union-clearing-insolvency-and-listing-package_en
Financial Stability Board (2022), Liquidity in Core Government Bond Markets.
Alberto Grassi, Thore Kockerols, Francesca Lenoci and Cosimo Pancaro (2022) Euro area interest rate swaps market and risk-sharing across sectors. ECB Financial Stability Review, November 2022.
Grace Hu, Jun Pan and Jiang Wang (2013) Noise as Information for Illiquidity. Journal of Finance 68, 2341–2382.
Mohammad Jahan-Parvar and Filip Zikes (2021) “When Do Low-Frequency Measures Really Measure Effective Spreads? Evidence From Equity and Foreign Exchange Markets. “Mimeo.
Rainer Jankowitsch, Amrut Nashikkar and Marti G. Subrahmanyam (2011) “Price Dispersion in OTC Markets: A New Measure of Liquidity.” Journal of Banking and finance, 35, 343-357.
Martin Scheicher and Andreas Schrimpf (2022) “Liquidity in bond markets – navigating in troubled waters.” SUERF Policy Brief, No 395.
Martin Scheicher (2023) “Intermediation in US and EU bond and swap markets: stylised facts, trends and impact of the COVID-19 crisis in March 2020.” ESRB Occasional papers, forthcoming.
Notional value as of June 2022 (BIS, 2022).
See EU Commission (2022).
Globally systemic banks, defined by the FSB: https://www.fsb.org/2022/11/2022-list-of-global-systemically-important-banks-g-sibs/
Under EU regulation (EMIR), standardised IRS are required to be traded electronically and cleared in CCPs with certain exceptions (at the time of writing pension funds do not need to use CCPs but can continue to clear bilaterally; this exemption is scheduled to expire in summer 2023). Commonly used trading platforms are provided by Bloomberg or Tradeweb.
The most important European CCPs for IRS are LCH Ltd (London) and Eurex (Frankfurt).
The Euro Interbank Offered Rate (Euribor) is a daily interest rate based on the rates at which banks offer to lend unsecured funds to other banks in the euro money market.
See Dalla Fontana et al. (2019) or Grassi et al. (2022).
We estimate all variables from the granular transaction data obtained from Trade Repositories. According to Jahan-Parvar and Zikes (2021) intraday estimation of trading conditions is more precise than estimation based on daily variables (e.g. daily highs and lows).
In this period, the ECB decreased the interest rate on the deposit facility by 10 basis points to -0.50% (as of 12 September 2019) and restarted net purchases at a monthly pace of €20 billion from 1st November 2019.
A caveat in the interpretation is that compression exercises run by CCPs affect the trends in notional volume. The interpretation of our empirical analysis is also affected by some limitations in the quality of trade reporting (e.g. frequency and treatment of outliers).
See Scheicher (2023) for further information.
We weight observations by notional amount (Vlmk,t / Vlmt) and then use the deviation from average daily price (P̄t) to reduce sensitivity to intraday volatility. To mitigate the impact of outliers due to fixed rates close to zero, we use absolute price dispersion instead of relative price dispersion.
For US Treasuries, we use a price-based measure based on Hu et al. (2013) obtained from Bloomberg.
See Scheicher and Schrimpf (2022) for further discussion.