The current structure for trading bonds and swaps builds on bank Dealers as core intermediaries. These firms provide essential liquidity to clients by buying and selling instruments in part from their own books. The purpose of this overview paper is to analyse the post-GFC role of bank Dealers in OTC fixed income markets. We focus on three questions: 1) Is trading of swaps and bonds converging to a “high-speed” setup with wide-ranging transparency and “all to all” trading? 2) What is the impact of the market changes on the Dealer business model? 3) How did the Covid shock in March 2020 affect the OTC bond and swap market? Overall, the evolution of fixed income markets creates new challenges for systemic risk mitigation and safeguarding of liquidity provision, which have also been highlighted by the Covid crisis in March 2020.
Bonds and the corresponding derivatives play a vital role in the global economy. Bonds are the main source of funding for governments. They provide a key monetary policy tool in the context of quantitative easing and also for serve as primary safe assets. The derivatives, in particular swaps2 are widely used to hedge key risks. The importance of resilient and well-functioning bond markets is further highlighted by the large – scale issuance of sovereign debt to counteract the COVID 19-related downturn in many countries. From an EU perspective, the functioning of major financial market is of particular interest due to the “Capital Market Union”, which is intended to foster economic growth via measures to improve the functioning of the EU financial market.
Bonds and swaps are traded in a decentralised mechanism between Dealers and clients “over the counter” (OTC) rather in centralised exchanges. Instruments are bought and sold in decentralised opaque transactions rather than via centralised order-driven mechanisms (Duffie, 2012).3 Bonds and swap trading relies on two distinct groups of traders: A “core” set of intermediary firms (henceforth “Dealers”) actively trades with all market participants. A group of smaller participants on the “periphery” (henceforth “Clients”) only trades with Dealers but not with other firms on the periphery (hence, no “all to all” trading unlike on exchanges).
The purpose of this paper is to discuss the current structure of bond and swap markets in the US and Europe. Overall, we argue that bank Dealers continue to hold a unique position in bond and swap trading. OTC markets have been reformed extensively since the GFC in 2008, with widespread use of electronic trading and central clearing and more stringent capital and liquidity requirements for Dealers. These structural changes have reduced the formerly dominant market position of the Dealers. In particular, the steady rise of “Principal Trading firms” (PTFs) provides tentative evidence for the evolution towards a market microstructure where also non-Bank Dealers may play a material role. The turmoil in financial markets after the outbreak of the COVID 19 virus has further emphasised the importance of the analysis of the OTC market structure. In March 2020, a number of bond segments, including US Treasuries faced a dislocation. This episode of market stress therefore also sheds light on how a large exogenous shock affects OTC trading in its new post-reform setup.
The outstanding volume4 of bonds and swaps exceeds equities by many orders of magnitude. Table 1 summarises the main bond and swap segments. The largest market is US Treasuries with $ 17 trn outstanding and daily volume of $656 BN. Outstanding notional in OTC derivatives market is US$ 544 trn, with Interest Rate Swaps accounting for more than half.
Box: Key concepts and technical termsBID-ASK SPREAD: Difference between price buyer and seller are willing to pay for an instrument. |
Typically, Dealers focus on intermediation. They match buyers and sellers rather than take directional positions in proprietary trading. Traditionally, asset managers, who often pursue a buy and hold strategy initiated a new transaction by phoning Dealers to find out about current quotes. For bonds, this business model implied that Dealers need to have an inventory, which requires repo market activity and creates a capital requirement. For swaps, the Dealers’ “flat-book” approach creates a demand for hedging, which then leads to further inter-Dealer trading. In addition to market making, Dealers indirectly contribute to market liquidity by providing funding to hedge funds and high-frequency traders via repos and offering access to market infrastructure. The close interaction of market and Dealer funding liquidity is a key driver of both the 2008 crisis and the Covid crisis.5
Table 1: Overview of bond and swap market
| IRS | CDS | US Corporates | US Treasuries | Bunds | |
| Notional size | $ 327 trn | $ 9 trn | $ 9 trn | $ 17 trn | $ 2 trn |
| Activity (per day) | One Dealer = 400 trades | Most single names < 20 trades | < one trade per bond | US$ 656 BN | $ 18 BN |
| Transaction costs | < 1 BP | < .5 BP (CDX IG) | 39 BP | < 1 BP (on the run) | > 5 BP |
| Electronic trading | Medium | Medium (index) | Low, but growing | High (on-the run) | Low |
| Role of Dealers | High | High | High | Medium (PTFs) | High |
| Role of PTFs | Medium | Low | Medium | High | Low |
| Covid crisis | Modest | Freeze in single-names | Dislocation | Dislocation | Modest |
Sources: BIS; Latest data available; Transactions costs measured via effective half-spread (cf. Collin-Dufresne et al, 2020);
The regulatory changes which started with the G-20 Pittsburgh Declaration in 2009 have fundamentally reformed OTC markets and therefore also the Dealer business. Global policy makers focused on reducing the opacity, complexity, interconnectedness and fragmentation in OTC markets. Concretely, three key reforms, which are monitored by the FSB are the obligation to trade most swaps on transparent platforms, to clear them centrally rather than bilaterally6 and comprehensive margining of derivatives exposures.
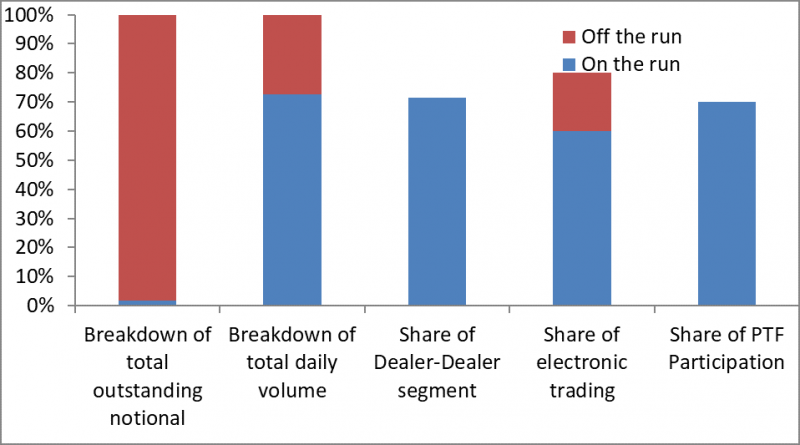
At the current juncture, market liquidity in the most important OTC fixed income market, U.S. Treasuries resembles an “Iceberg”. On-the-run bonds (benchmarks) represent the most liquid segment with 70% of interdealer trading on electronic platforms and PTFs7 already accounting for 60% of traded volume. As a result, the half-spread for the most liquid Treasuries is less than one cent. However, on the-run notional issuance is only $250 BN. In contrast, for off-the run bonds, which represent the bulk of outstanding notional at $ 13 trillion electronic trading and hence also PTF participation is much less prevalent. A similarly fragmented microstructure is also observed for US corporate bonds, where half spreads of 39 cents are measured, thereby indicting the impact of trading conditions on transaction costs.
Chart 1: The “Iceberg” structure of US Treasury trading8
Overall, despite growth in PTF activity bank Dealers continue to dominate bond and swap trading. Electronic trading of bonds and swaps in the US and EU is not yet on the level of exchange trading in the stock market, where high-frequency trading is common. “All to all” trading with a fully centralised matching mechanism has only taken hold in a few segments such as index CDS. The majority of corporate bond transactions are facilitated by Dealers as “principal” trades, where Dealers commit capital to take bonds into inventory.9 Dealers also continue to contribute the majority of swap trades cleared in CCPs.
In sum, increasing use of electronic trading linked with the advance of PTFs and the low-rate environment have increased pressure on the Dealer business model. Electronic trading reduces opacity and therefore also the information advantage of incumbent Dealers. Space on the balance sheets of bank Dealers is now much more expensive than before the crisis of 2008. Dealers have reacted by cutting back their market making. As a consequence, emerging “limits to arbitrage” may lead to dislocations in relative pricing.10
In contrast to the 2008 crisis, which was driven by counterparty credit risk, the Covid turmoil in March 2020 was focused on a breakdown of the market liquidity of investment grade bonds. The high volatility following the initial macro shock sharply increased the margins called by CCPs and as a consequence, a “Dash for cash” among non-bank investors started.
The epicentre of the Covid crisis was in US Treasuries11 and US corporate bonds12. Trading conditions sharply worsened with high intraday volatility13, rising transaction costs, disappearing depth and growing fragmentation between the prices of bonds and corresponding derivatives (eg Treasury futures). Large scale selling from asset managers, foreign entities and leveraged investors met reduced readiness by Dealers to warehouse Treasuries, in part because of balance sheet constraints and risk limits. As a reaction, the Federal Reserve launched a range of facilities, thereby increasing its balance sheet by around $3 trn.
In the Bund market, yield volatility also rose to levels last seen during the euro area sovereign debt crisis. However, the jump in bid-ask spreads was smaller in Bunds than in US Treasuries or UK Gilts.14 A specific factor in the German compared to the US bond market is the extensive activity of the Eurosystem via the PSPP.
Overall, this episode highlights the role of the central bank as “bond Dealer of last resort”. By serving as the other side of the trade bank Dealers could continue market-making with reduced inventory risk. The Fed also temporarily eased the leverage ratio rule, allowing banks to exclude cash and Treasuries from their “total assets”. Also the SSM launched a package of measures.15
Overall, the Covid market turmoil has reemphasised the systemic importance of OTC markets. The crisis sheds light on the state of play for two vital policy questions:
At the time of writing, these policy questions are the subject of ongoing work by international standard setters (cf. FSB, 2020).
Adrian, T., J. Kiff and H.S. Shin (2018) Liquidity, Leverage, and Regulation 10 Years After the Global Financial Crisis. Annual Review of Financial Economics 10, November 2018, pp. 1-24.
Bessembinder, H, C. Spatt and K. Venkataraman (2019) A survey of the Microstructure of the Fixed Income Markets. Journal of Financial and Quantitative Analysis, forthcoming.
Collin-Dufresne, P., B. Jung and A. Trolle (2020) Market Structure and Transaction Costs of Index CDSs. Journal of Finance, forthcoming.
Duffie, D. (2012) Dark Markets: Asset Pricing and Information Transmission in Over-the-Counter Markets, Princeton University Press.
Duffie, D. (2018) Financial Regulatory Reform After the Crisis: An Assessment. Management Science 64(10): 4835–4857.
Duffie, D (2020) Still the World’s Safe Haven? Redesigning the U.S. Treasury Market After the COVID-19 Crisis. Hutchins Center Working Paper 62.
Duffie, D., Scheicher, M., and Vuillemey, G. (2015). Central clearing and collateral demand. Journal of Financial Economics, Vol. 116, No. 2, pp. 237-256.
Financial Stability Board (2020) Holistic review of the March Market Turmoil.
Harkrader, J.C. and M. Puglia (2020). Price Discovery in the U.S. Treasury Cash Market: On Principal Trading Firms and Dealers. Finance and Economics Discussion Series 2020-096, Board of Governors of the Federal Reserve System.
O’Hara, M. and A. Zhou (2020) Anatomy of a Liquidity Crisis: Corporate Bonds in the Covid-19 Crisis. Working Paper.
Pelizzon, L., M.G. Subrahmanyam, D. Tomio and J. Uno (2020) Central Bank–Driven Mispricing. SAFE Working Paper.
Sarkar, D., G. Pandey and R. Krishnamachari (2020) Liquidity Landscape in 2020. BofA Securities.
European Central Bank; Kaiserstrasse 29, D – 60311, Frankfurt am Main, Germany. Tel: +49+69 1344 8337; Email: martin.scheicher@ecb.int. The opinions in this paper do not necessarily reflect those of the ECB, the SSM or the Eurosystem. Discussions with Darrell Duffie, Alex Duering, Loriana Pelizzon and Pierre Collin-Dufresne are gratefully acknowledged.
See box for further details on key concepts and terms.
One driver of OTC bond trading is low standardisation. For example, a major industrial firm would issue one class of equity (listed on an exchange) but hundreds of bonds in different cash-flow structures or currencies.
Data on notionals are from the BIS; https://www.bis.org/statistics/derstats.htm?m=6%7C32%7C71
See e.g. Adrian et al. (2018).
Duffie et al (2014) offer a detailed study of CCP mechanisms and the impact on collateral.
Harkrader and Puglia (2020) study PTFs. Collin-Dufresne et al. (2020) study transaction costs for index CDS.
In Percent of notional values; Source: Federal Reserve and author’s calculations;
See e.g. Bessembinder et al (2019).
See the discussion on Dealer business models in Duffie (2018).
See Duffie (2020) for analysis and policy proposals.
See O’Hara and Zhou (2020) for a detailed discussion.
The yield volatility on US Treasury ten-year notes in March exceeded the levels of the crisis in 2008.
Sarkar et al. (2020).
https://www.ecb.europa.eu/press/pr/date/2020/html/ecb.pr200312~45417d8643.en.html