The views expressed in this note are those of the authors and do not necessarily reflect those of the European Central Bank or the Eurosystem.
The recent rise in inflation renewed the interest in how households respond to inflation. This note shows that households differ considerably in the inflation they experience at any point in time. The main sources of inflation heterogeneity are spatial differences in the prices paid and differences in the product choice of households. The households’ substitution between products is largely detached from the relative price, which might be due to time time-varying tastes. The heterogeneous individual inflation experience might explain why households react differently to aggregate inflation fluctuations.
The heterogeneity of inflation among households has gained a lot of attention (e.g., Claeys and Guetta, 2022), especially in the context of a potentially relevant loss of purchasing power due to the recent jump in the price level. Heterogeneous household inflation experiences can feed into inflation perceptions and expectations and, in turn, entail a seemingly heterogeneous household reaction to aggregate inflation. Moreover, systematic inflation differences among households can have distributional effects.
This note describes the nature, evolution, and sources of inflation heterogeneity across a large household panel1 collected in France and Germany. We find large and persistent dispersion of inflation rates across households, with the interquartile range exceeding three percentage points in both countries throughout the sample period. Despite modest mean reversion at a one-year horizon, the inflation differences across households are very persistent. The two main sources of inflation heterogeneity are differences between regions in the price changes of identical products and differences between households in their product choice. The substitution of one product by another is strongly behaviour-driven, largely detached from the relative price, and thus does not reduce the dispersion of inflation.
Households typically differ in the locations and days of their purchases and potentially also in the use of individual discounts despite purchasing the same product. As a result, in any given quarter, they often pay very different prices for the same product and thus experience different price changes relative to earlier quarters. In order to examine how these translate into inflation differences, we calculate household-level inflation rates both with household-specific prices and with prices averaged across households residing in a given region. By averaging over larger and larger regions, first the effect of individual and subsequently also the effect of local price differences is removed.
Chart 1: Distribution of household-level inflation rates with household-level and regional prices
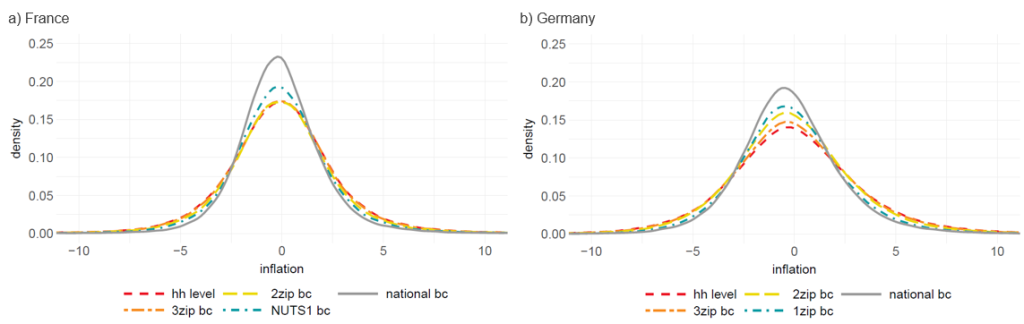
Note: Densities of year-on-year change of Laspeyres indices for all fourth-quarter pairs in the sample pooled together. The densities are a non-parametric estimate based on a parabolic weighting function (Epanechnikov kernel).
Chart 1 shows the distribution of household-level inflation rates with household-level and regional prices. In both countries, the dispersion of household-level inflation rates with subregional product-average prices (3-digit and 2-digit postal areas plotted as orange and yellow lines, respectively) is very close to the dispersion with household-level prices (red lines). In other words, the contribution of the household-specific component of price heterogeneity, which captures, among other things, coupon use, search effort, or personalized offers (all for a given product), is largely negligible.
When averaging prices within large top-level regions in each country, a modest compression of the distribution is discernible (blue line), but only averaging nation-wide reduces inflation dispersion a lot (grey lines). The chart illustrates that differences in prices paid for the same product within a country play an important role for inflation heterogeneity, but these price differences are mostly due to differences between larger regional units (e.g., metropolitan vs. rural regions) rather than among individual households within a region.
The decomposition of the household-level variance into its components in Table 1 quantifies this link betweeninflation dispersion and price aggregation. The household-specific component contributes only about 3% in France and 7% in Germany to the total variance, while the spatial component contributes almost 40%.
Table 1: Variance ratios of counterfactual indices vs. index with household-level prices
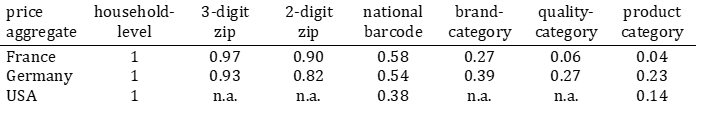
Note: Details of the calculation are described in Kiss and Strasser (2024). The results for the USA are taken from Table 1 in Kaplan and Schulhofer-Wohl (2017).
Product choice within a given brand and the choice of brand within a given quality level explain together about 50% of inflation dispersion in France and about 30% in Germany. In the USA, the price differences between both households and regions appear to be more prominent (Kaplan and Schulhofer-Wohl (2017), whereas in Switzerland product choice plays a more central role (Braun and Lein, 2020). In Germany, the differences in the top-level category composition of the consumption basket are an important driver as well, accounting for more than 20% of the total variance.
Can these inflation differences be traced to differences in household behaviour or household demographics? In fact, more than 80% of the overall variance of household-level inflation rates is due to time variation within the same household, most of which is not captured by the observed household characteristics. Among the timevarying variables, behavioural variables (such as variety choice, shopping channels and intensity) explain around 70% of the systematic variation in household-level inflation rates, while demographic variables (such as income and household size) explain little. Income heterogeneity, for example, is by itself not a relevant determinant of inflation heterogeneity. A significant and time-varying inflation difference between income groups emerges only indirectly, due to the correlation of income and household behaviour.
Households might offset some of the price change of products they are used to consume by substituting towards products getting relatively cheaper. While they do so on average, they often substitute towards products getting more expensive.2 This counterintuitive pattern holds not only when the inflation rates are calculated with (actual) household-level prices, but also with (counterfactual) prices averaged at the product level. Purchasing at a locally discounted price in the base period and then at a regular price in the later period therefore cannot be the cause. As this pattern holds even with prices averaged across brands and quality tiers (within a given product category), it suggests a strong role for preference heterogeneity across households.
Commonly used inflation indices are so-called cost-of-goods indices, which track the price of a constant basket, i.e., they abstract from the ability of households to substitute between products. An alternative approach measures the change in expenditures required to maintain a constant level of utility. Measuring inflation by such a cost-of-living index with constant preferences (shown by the blue line in Chart 2) instead of a cost-of-goods index with a fixed ex-ante basket (shown by the red line in Chart 2), however, returns largely the identical inflation dispersion estimates. That is, the effect of substituting towards products getting relatively cheaper and the effect of households’ heterogeneous preferences just offset each other, and thus allowing for heterogeneous substitution behaviour does not change measured inflation heterogeneity.
Chart 2: Interquartile range of cost-of-good index vs. cost-of-living indices
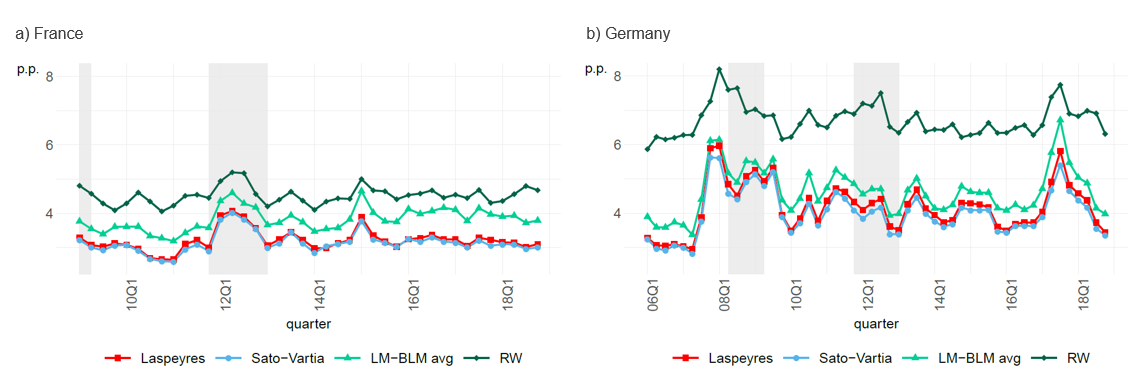
Note: Interquartile range of quarterly year-on-year household-level indices. ‘Sato-Vartia’ denotes the Sato (1976)- Vartia (1976) index, ‘LM-BLM avg’ denotes the geometric average of the Lloyd-Moulton and the Backwards Lloyd-Moulton indices of Martin (2022), ‘RW’ denotes the Redding-Weinstein (2020) index. Food and beverages only, restricted to households that repurchase at least 25 products in both quarters.
The picture changes only once allowing for time variation in preferences, which increases the estimated interquartile range by 50% and more.3 At the household-level, preference heterogeneity across goods and over time are separate components of inflation heterogeneity. A regression of the (small) substitution bias and of preference shifts on household characteristics shows that many household characteristics affect these in opposite directions.4
As this note has illustrated, households are very heterogeneous even within seemingly narrowly defined groups, such as, e.g., a given low-income group. They differ in their shopping behaviour, product choice and consumption basket and therefore end up with very different inflation rates – despite having similar income. Assumptions such as, for example, common real interest rates or common inflation expectations might thus be quite imperfect descriptions of reality. Focusing on a single dimension of inflation heterogeneity, such as income alone, would fall short of accounting for the vast heterogeneity in the population of consumers.
Braun, R. and Lein, S. M. (2020): “Heterogeneity in inflation and preferences across households”, Mimeo.
Claeys, G. and Guetta-Jeanrenaud, L. (2022): “Who is suffering most from rising inflation?”, Bruegel Blog, available at https://www.bruegel.org/2022/02/who-is-suffering-most-from-rising-inflation.
Kaplan, G. and Schulhofer-Wohl, S. (2017): “Inflation at the household level”, Journal of Monetary Economics, 91 (C), 19–38.
Kiss, R. and Strasser, G. (2024): “Inflation heterogeneity across households”, ECB Working Paper 2898.
Martin, R. S. (2022): “Revisiting taste change in cost-of-living measurement”, Journal of Economic and Social Measurement 46 (2), 109–147.
Redding, S. J. and Weinstein, D. E. (2020): “Measuring aggregate price indices with taste shocks: Theory and evidence for CES preferences”, Quarterly Journal of Economics 135 (1), 503–560.
Sato, K. (1976): “The ideal log-change index number”, Review of Economics and Statistics 58 (2), 223–228.
Vartia, Y. O. (1976): “Ideal log-change index numbers”, Scandinavian Journal of Statistics 3 (3), 121–126.
This note summarizes the results of Kiss and Strasser (2024). The analysis is based on household panels for Germany (GfK, 2005-2018) and France (Kantar, 2008-2018). The panels contain prices, quantities, and product characteristics of the everyday purchases of households together with basic information on income and demographics of the households.
At the disaggregated level of individual households, the annual change in the Paasche index is often larger than in the Laspeyres index.
When averaging preferences between two periods (e.g., by an average of the Lloyd-Moulton and Backward-Lloyd-Moulton indices as in Martin (2022)) the interquartile range widens by up to 20%. When taste can freely vary over time (Redding-Weinstein index as in Redding and Weinstein (2020)) it increases to ranges 44% (France) and 67% (Germany) larger than under the constant-taste assumption (Sato-Vartia index).
Substitution bias is defined here as the difference between Laspeyres and Sato-Vartia index, and preference shifts as the difference between the Sato-Vartia and the Redding-Weinstein index.