menu
close

Author(s):

Guido Ascari | De Nederlandsche Bank
Paolo Bonomolo | University of Pavia
Qazi Haque | University of Adelaide

Keywords:

Long-Run Phillips Curve , Inflation , Bayesian VAR , DSGE , Particle Filter

JEL Codes:

C32 , C51 , E30 , E31 , E52

This Policy Brief is based on DNB Working Paper No. 789. Views expressed are those of the authors and do not necessarily reflect official positions of De Nederlandsche Bank.

Is there a relation between inflation and output in the long run? The answer is no, according to undergraduate macroeconomics textbooks. In a recent DNB working paper (Ascari et al. 2023) we question this view by showing that, in US data, inflation and output are negatively correlated in the long run: persistently high inflation is associated with sizeable output losses.  Under the natural rate hypothesis introduced by Phelps (1967) and Friedman (1968), there is a short-run tradeoff between inflation and output (or the unemployment rate), but this tradeoff disappears in the long run. This idea has been playing a cornerstone role in macroeconomics, inspiring the development of modern monetary theories and becoming one of the working assumptions of central banks in the implementation of monetary policy.
A time series estimate of the long-run Phillips curve

Given this important role, our analysis focuses on the empirical relationship between inflation and output in the long run, commonly known as the long-run Phillips curve (LRPC). First, we estimate the LRPC using a flexible time-series model. We find that inflation and output are negatively correlated in the long run: persistently high inflation is associated with lower potential output.
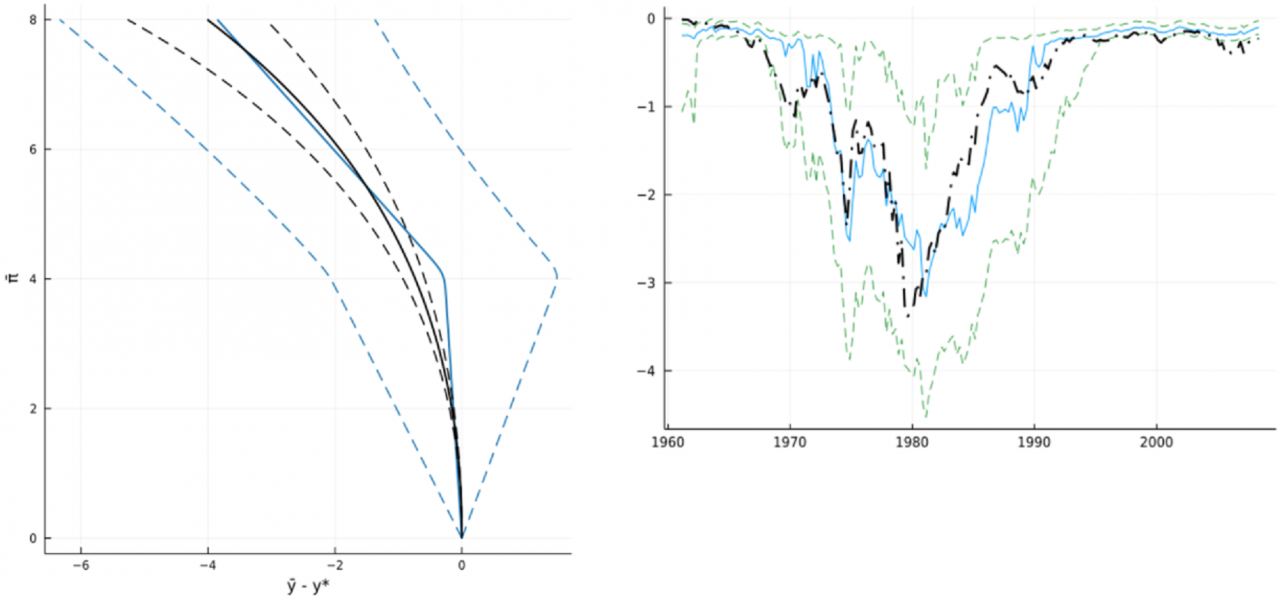
It is important to stress that we find this result by modelling this relationship to be potentially non-linear. In particular, we approximate the non-linearity through a piecewise linear function and identify a threshold level of underlying inflation of about 4%, below which potential output is independent of trend inflation, and above which every percentage point increase in trend inflation is related to about 1% decrease in potential output per year. The estimated LRPC using this time-series model is showed in the left panel of Figure 1 (blue lines), where we put the trend inflation in the y-axis, and the difference between potential output and its counterfactual level under zero trend inflation in the x-axis.

A structural approach

The negative non-linear relation between trend inflation and potential output estimated using the time-series approach is, however, a “mere” statistical correlation. To provide an explanation for this relationship, one would need further theoretical assumptions formalised through the lens of a structural model.
Introducing a structural model in which the LRPC is not “vertical” might seem controversial as this would lead to a framework where monetary policy can affect real variables in the long run. Before exploring this argument, it is worthwhile to distinguish the concept of neutrality from the one of super-neutrality of money. Under neutrality, a change in the level of money only affects prices and does not affect real quantities. Super-neutrality is a stronger requirement: it states that a change in the growth rate of money only affects prices and does not affect real variables. While neutrality of money in the long run is a widely accepted requirement for any reasonable monetary theory, super-neutrality in the long run does not hold in several macroeconomic models, most notably (under general assumptions) in the New Keynesian (NK) model,1 which is the most commonly used macroeconomic framework by both the research community and central banks. Since, in theory, inflation is related to the growth rate of money, the concept of super-neutrality in the long run is the one we consider, and the NK model is the most natural framework to interpret our findings. In the NK framework, the causality goes from inflation to output: higher trend inflation causes lower output in the long run, because of the increase in price dispersion that creates an aggregate inefficiency, as shown by Ascari and Sbordone (2014).
To assess the empirical relevance of the LRPC within this structural framework, we estimate a small-scale NK model generalized to allow for time-varying trend inflation. Here we can explicitly interpret the LRPC as a relation that measures the costs of trend inflation. The black lines in the left panel of Figure 1 show our estimated LRPC using the NK model: the potential output losses associated with positive trend inflation are comparable to the ones estimated through the piecewise linear time series model.
Figure 1: Comparison between time series model (blue) and structural model (black)
 width=
Left panel: estimates of the long-run Phillips curve (median and 90% probability interval).
Right panel: estimates of the long-run output gap (median estimates in blue and black; green lines plot the 90% probability interval from the time-series mzodel).

Evaluating output losses

Both the time series and the structural models indicate that when trend inflation is between 6 and 8 per cent, potential output is between 2 and 4 per cent lower (per year) than its counterfactual level under zero trend inflation. These numbers are remarkably high. To get a sense, the right panel of Figure 1 shows the estimated loss of US GDP over time: during the Great inflation period, output has been on average about 2% lower due to higher trend inflation.

Conclusions

The recent surge in prices in advanced economies has drawn renewed attention to the importance of preventing inflation from being persistently higher than the central bank target. In this paper we show that the long-run output losses associated with periods of persistently high trend inflation might be particularly big. From a theoretical perspective, these findings question the textbook notion of a “vertical” LRPC. From a practical point of view, our results provide an additional argument to forcefully fight against high inflation.

References

Ascari, G, P. Bonomolo and Q. Haque (2023). The long-run Phillips curve is… a curve. Working Papers 789, DNB.
Ascari, G. and A. M. Sbordone (2014). The macroeconomics of trend inflation. Journal of Economic Literature 52(3), 679–739.
Friedman, M. (1968). The role of monetary policy. The American Economic Review 58(1), 1–17.
Phelps, E. S. (1967). Phillips curves, expectations of inflation and optimal unemployment over time. Economica 34(135), 254–281.
  • 1.

    See Ascari and Sbordone (2014).

About the authors

Guido Ascari

Guido Ascari is the head of Monetary Research at De Nederlandsche Bank and Professor of Economics at University of Pavia. He was formerly a professor of Economics at Oxford University. His main contributions to the literature deal with the analysis of monetary policy and inflation dynamics. He holds a Ph.D. in Economics from the University of Warwick and from the University of Pavia.

Paolo Bonomolo

Paolo Bonomolo is a researcher at the Research Department of De Nederlandsche Bank. Before joining DNB he has been working at the Modelling Division of the Sveriges Riksbank. He obtained a Ph.D in Economics from University of Pavia.

Qazi Haque

Qazi Haque is a Lecturer in the School of Economics and Public Policy at The University of Adelaide. Previously, he worked as an Economist at the Reserve Bank of Australia and as a Post-Doctoral researcher at The University of Western Australia. He is currently serving as the Secretary in the Executive Board of The Australasian Macroeconomics Society. He is affiliated as a Research Associate in the Centre for Applied Macroeconomic Analysis (CAMA) at the Australian National University. He holds a Ph.D. in Economics from The University of Adelaide.

More on these topics

Tags: