
This Policy Brief is based on LUISS Working Paper 9/2024. The views expressed are those of the author and do not necessarily reflect the opinions of any organization to which the author is affiliated.
In this paper, I look at the concept of a “middle income trap” and its validity for China. I find that the fundamental growth drivers for China are becoming exhausted: capital accumulation has reached unsustainable levels and labor contribution is likely to decrease, among other reasons due to demographic shrinking. Innovation, or the “Solow residual”, is the wild card, and is likely to determine China’s growth path going forward.
The spectacular economic rise of the Peoples Republic of China (PRC) as an economic powerhouse during the last decades is the most important structural change in the world economy since the end of the Cold War in the late 1980s. However, a recent but sustained reduction in the growth prospects of the PRC have become subject to an intense discussion. In this paper, I assess the validity of the so-called “middle income trap” for China (for earlier studies, see Cai, 2012, Islam, and Zhou & Hu, 2021). I conclude that the future of the PRC is exceptionally uncertain at this stage due to the interlinked trajectories of PRC’s future growth and future (de-)globalization developments and the path of its domestic political and policy developments.
The concept of middle-income trap has been mainly used to describe countries that suffer from a sharp drop in economic dynamism after a successful transition from low- income to middle-income status, preventing them from moving to a higher income level (Gill & Kharas, 2007).1 While most of these slowdowns take place in the transition from low- to middle-income, works have found that the growth slowdowns can happen at different stages of development, including in high-income economies (for instance, see Vinhas de Souza & Diaz, 2024, who deal with the case of Portugal). In development economics, “traps” are understood as a persistent and stable state of low growth, and escaping from the “trap” requires a policy shock or structural change (in an EU membership context, EU entry can also be seen as a strategy to exit such a “trap”: Vinhas de Souza & Diaz, ibid, and Vinhas de Souza et al., 2018).
Several studies concur that at the core of these middle-income slowdowns is stagnating productivity growth. Eichengreen, Park, & Shin (2014) examine a large panel of countries and conclude that falling productivity explains over 80 percent of the reduction, and Vinhas de Souza & Diaz, ibid, reach a similar conclusion for the prolonged growth slowdown in Portugal. Having said this, several works also question the very existence of a “trap” altogether, considering, for instance, what is the time frame to decide that a “trap” has indeed happened (see Larson, Loayza & Woolcock, 2016, Im & Rosenblatt, 2014, and Bulman, Eden & Nguyen, 2014).
Based on the Solow growth model (Solow, 1956), growth accounting exercises assess the relative contribution of labor, capital and technology to the economic growth of a country using a so-called Cobb-Douglas production function, see formula below, where Y is GDP, and K and L are, respectively, capital and labor stock, and A is total factor productivity (or TFP). Note that since TFP growth is the residual value after the contribution of capital growth has been subtracted from output growth, it is also called the Solow residual (since output, capital and labor can be observed, but A cannot, the most basic approach to estimate it is the so-called residual method, which assumes that α is equal to the share of capital income in national income).

Looking at China’s long-term growth dynamics (Figure 1), an immediately apparent feature is its volatility, especially in the pre-1990 period: the standard deviation of growth rates pre-2000 is 8, a value that falls by two thirds to 2.7 for the post-2000 sample.
Figure 1: China’s long term real GDP growth rate, 1953-2023
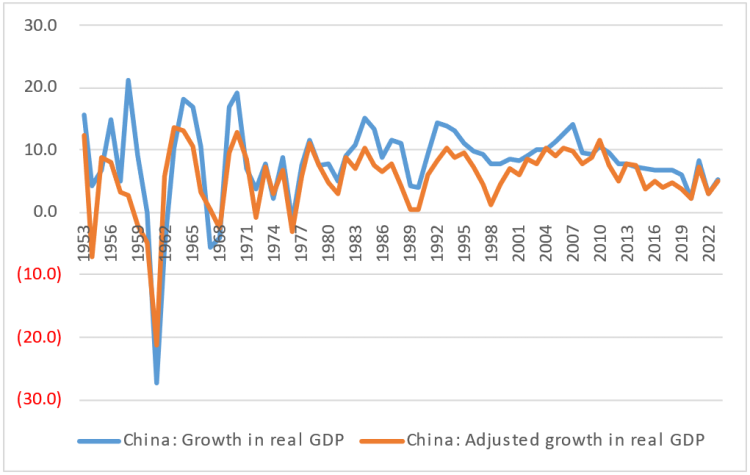 Source: The Conference Board.
This happens because the PRC was buffeted by a long series of large (mostly) domestic political and policy shocks during this period: from the end of China’s involvement in the Korean War in 1953 to the extreme violence and instability of the “Great Leap Forward”, the forced industrialization and collectivization period from 1958 to 1961, a brief war with India in 1962 (and ongoing border disputes), the political terror, mass purges and killings during the 1966-1976 “Cultural Revolution” (not to mention the PRC’s parallel prolonged shadow involvement in the Vietnam War and its own invasion of Vietnam in 1979), to the massacres and political prosecutions associated with the 1989 Tiananmen Square protests, to a period of greater stability, economic liberalization and international integration policies that lasted from the 1990s until the ongoing progressive reassertion of centralized, authoritarian government policies, and renewed confrontational stances towards external partners since Xi Jinping’s rise to power in 2012. This later period is associated with the current growth slowdown.
Another important point of the graph is the frequent concerns about the reliability of Chinese data. Notably, data concerning stocks of capital and labor are necessary to perform the growth accounting exercises using the production function described above. As the available series are simply not consistent with headline GDP figures, an “adjusted” GDP series is produced which is consistent with its underlying components (for a comprehensive description of its’ construction, see Wu, 2014). This adjustment procedure does not significantly affect the volatility of the series (the pre-2000 data is still much more volatile than the one after that year), but it affects levels: not only are the average levels of GDP growth noticeably lower with the adjusted series (5.6% p.a., as opposed to 8.1%), but the difference in growth pre- and post-2000 is noticeable (it hardly exists for the non-adjusted series, while for the adjusted series the average value is almost 2 p.p. per annum higher after 2000). The adjusted series is the one used in the growth decomposition exercise shown in Figure 2.
Figure 2: A growth decomposition exercise for China, 1953-2024*
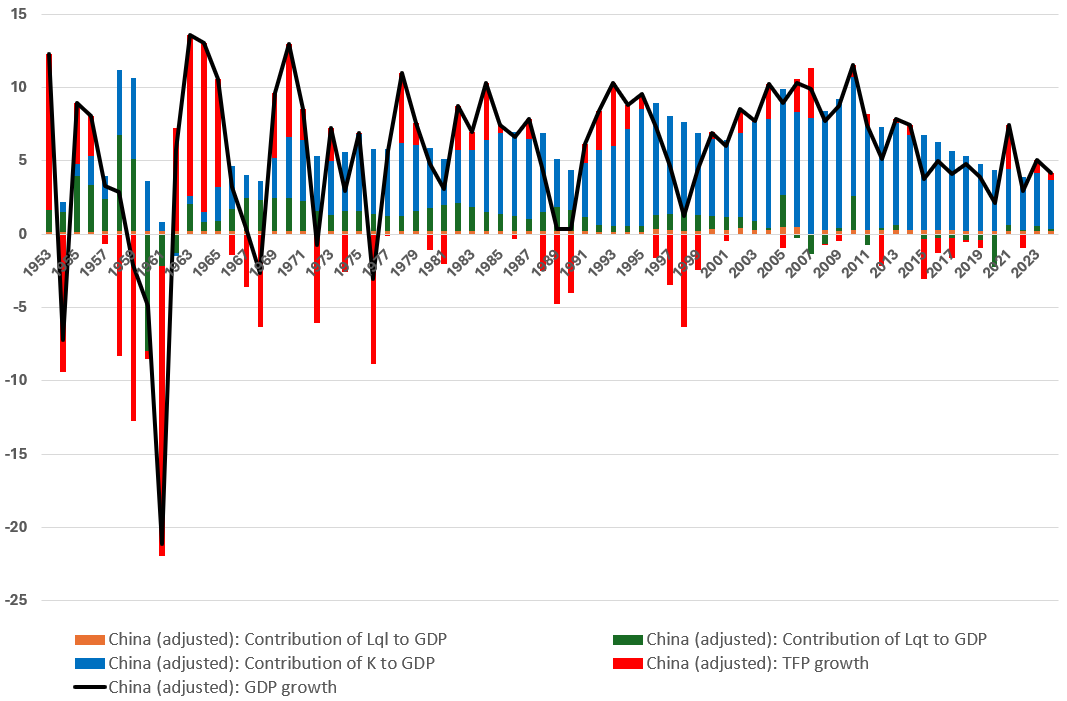 Source: Estimation by the author, based on Conference Board data.*: 2024 values are estimates.
The most striking feature of the data in Figure 2 is the overwhelming importance of capital accumulation for growth: more than 81% of the total growth observed during the period comes from capital deepening, over 20% from labor (quantity, 16%, quality, 4%), while TFP is, on average, negative, at -0.1%. Table 1 breaks this down by decade.
Table 1: Average growth decomposition for China per decade, 1953-2024*
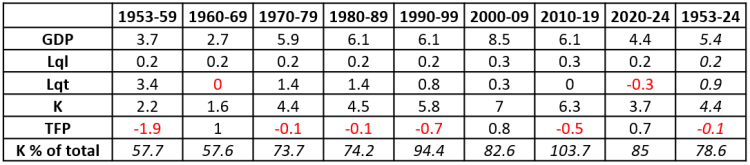 Source: Estimation by the author, based on Conference Board data.*: 2024 values are estimates.
China’s overreliance on investment for sustaining growth, with well over 40% of GDP being invested annually – remarkably, this value is still below the PRC’s huge savings rate of almost 50% of GDP – is widely known, and this is demonstrated by the data above: from less than 60% in 1950s, investment was responsible for over 100% of growth in the 2010s. As a matter of fact, from the years of the “Global Financial Crisis” (2008-09) onwards, a contribution of investment –including in unproductive activities like housing– to total growth in China above 100% becomes almost commonplace. This is not only unsustainable, but it leads to crises: for example, the Chinese housing bubble has already began to unwind.
China’s ongoing demographic transition (the overall population shrinking in China started in 2022; India is now the most populous country on earth, not China, while its active population peaked already in 2011) also implies that there are limits to the contribution of labor quantity to growth. At the same time, very high levels of youth unemployment above 16% –and with graduate youth unemployment estimated at around a 25%– may suggest decreasing returns to the accumulation of labor quality (or at least to the accumulation of certain types of higher education, similarly to what is observed in other economies, including developed ones).
This leaves us with TFP as a growth engine. While overall TFP contribution to growth in China has been historically disappointing, given increased investment in R&D, manifest in the truly geometric growing number of Chinese patents, one would assume there is a potential to a growth upside from it. This said, a more closed PRC –a process driven by Chinese policy actions, and by progressively more assertive (counter) measures by the U.S. and its allies, from the European Union to Japan and Korea– with R&D investment increasingly directed to security and defense-linked activities may suggest more limited growth effects from innovation in such a setting.
Does all this therefore amount to a “middle income trap”? After all, China’s medium-term forecast suggests growth above 4% p.a., which is a far cry from the above 10% of the 2010s but somewhat above the developing economies aggregate –albeit considerably below that of India, the other emerging giant, which also shows that China’s growth deceleration is not necessarily shared by other developing economies– and in any case still much higher than in developed economies (to say nothing of historical norms). Thus the answer to the “trap” question rests on the future trajectory of TFP, which happens to be a variable amenable to policy choices.
Also, regardless of the analytical soundness or empirical relevance of the “middle income trap” concept, it may be useful to focus on and shape policy discussions around the challenges faced by middle-income countries, hopefully leading to more effective policies, given that when factor accumulation growth reaches a decreasing return to scale state, economies must switch to a growth strategy based on innovation and productivity improvement (Larson, Loayza & Woolcock, ibid). However, the perspective or fear of being stuck in a “trap” can alternatively lead to a “doubling down” on previous strategies, namely growth based on factor accumulation: China may have indeed fallen into this particular “trap”, as demonstrated by its investment (over)reliance.
China had a truly remarkable growth run since it adopted in the 1990s a market and international integration-led development strategy. This paper has contributed to the literature by providing a unique long-term analysis of macro growth determinants in China, using also the most recent data available. It concludes that the natural exhaustion of the previous factor accumulation led strategy, compounded by a sharp reversal of earlier successful market and international integration policies, led to a growth slowdown, albeit to still relatively high levels.
A development strategy that recognizes the need for a different model, while still prioritizing market mechanisms and international integration as tools to support an innovation-led growth path, would be a promising way to avoid different “traps”. For example, a PRC that has greater domestic financial depth and diversity and is more financially integrated in the world would reduce the level of overinvestment and unproductive bubbles like the one in the real estate sector (World Bank, 2013).2
Some answers to what is the future growth path of China – a matter that has crucial implications for the global economy, may be partially provided at the upcoming Third Plenum of the Chinese Communist Party’s (CCP) Central Committee – so-called because it is the third session of the committee’s five-year term – on 15-18 July 2024.
Bulman, D., Eden, M. and Nguyen, H., (2014), “Transitioning from Low-Income Growth to High Income Growth: Is There a Middle Income Trap?”, Policy Research Working Paper No. 7104. World Bank, Washington DC.
Cai, F. (2012), “Is There a ‘Middle-income Trap’? Theories, Experiences and Relevance to China”, China & World Economy, 20(1), 49–61.
Eichengreen, B., Park, D. and Shin, K. (2014), “Growth Slowdowns Redux”, Japan and the World Economy 32: 65-84.
Gill, I. and Kharas, H., (2007), “An East Asian Renaissance: Ideas for Economic Growth”, World Bank, Washington DC.
Im, F. and Rosenblatt, D., (2014) “Middle-Income Traps: A Conceptual and Empirical Survey”, Policy Research Working Paper No. 6594, World Bank, Washington DC.
Larson, G., Loayza, N. and Woolcock, M., (2016), “The Middle-Income Trap: Myth or Reality?”, World Bank Research and Policy Briefs No. 104230.
Solow, R., (1956), “A Contribution to the Theory of Economic Growth”, Quarterly Journal of Economics, 70(1): 65-94.
Vinhas de Souza, L. and Diaz, D., (2024), “Crescimento e Convergência em Portugal: Experiência Histórica e Políticas a Nível Nacional e Metropolitano”, Position Paper n. 5/24, SEDES, Lisbon, Portugal.
Vinhas de Souza, L, Dreute, O., Isaila, V. and Frie, J-M. (2018), “Reviving convergence: making EU member states fit for joining the euro area”, in E. Nowotny, D. Ritzberger-
Grünwald and H. Schuberth (eds), Structural Reforms for Growth and Cohesion: Lessons and Challenges for CESEE Countries and a Modern Europe, Edward Elgar.
World Bank, (2013) “China 2030. Building a Modern, Harmonious, and Creative High-Income Society”, World Bank, Washington DC and Development Research Center of the State Council, The People’s Republic of China.
Wu, H. (2014), “China’s Growth and Productivity Performance Debate Revisited – Accounting for China’s Sources of Growth with a New Data Set”, The Conference Board Working Paper Series.
Zhou, S. and Hu, A. (2021), “China: Surpassing the “Middle Income Trap”, Palgrave Macmillan, UK.
For transparency’s sake, one of the authors of the seminal reference in this literature is a former World Bank colleague and co-author of the author of this piece.
This author was one of the co-authors of the financial integration section of this paper, which is conceptually linked to the so-called “Washington Consensus” literature, a set of combined policies of structural reform and global integration seen as having welfare-improving effects. Unusually for World Bank analytical papers, this was also a work co-written in uniquely close cooperation with (earlier) Chinese Governments.
