menu
close

Author(s):

Sun Guofeng | People’s Bank of China
Daniel Rees | Bank for International Settlements (BIS)

Keywords:

Real interest rate , natural interest rate , monetary policy

JEL Codes:

E32 , E40 , E44

The growth of China’s economy and development of its financial markets has created a need for tools to evaluate the stance of monetary policy in China. We contribute to this effort by providing estimates of China’s natural interest rate. We find that China’s natural interest rate averaged between 3-5 per cent between the late 1990s and 2010s, but declined over the next decade to around 2 per cent at the end of 2019. We attribute slightly more than half of the decline in China’s natural interest rate to a lower rate of potential output growth. Our results also suggest that real policy interest rates in China have closely tracked the natural rate over our sample.

Over the past few decades, China’s economy has experienced an extraordinary transformation. As the economy has grown and financial markets have developed, the conduct of monetary policy has evolved from a quantity-based framework based on controls of monetary and credit aggregates to a market-based system where short- and medium-term policy interest rates increasingly serve as the main policy instruments. This has created a need for tools to evaluate the stance of monetary policy in China. We contribute to this effort by providing estimates of China’s natural interest rate.

We define the natural interest rate as the real interest rate that would be consistent with a closed output gap and stable inflation over the medium run. According to this definition, the natural interest rate is not an ‘optimal’ rate. Nor is it the one that would stabilise output and inflation at any point in time. Instead, it provides a benchmark for whether monetary policy is expanding or contracting the economy. It also indicates where we might expect real interest rates to settle after temporary cyclical factors have abated.

Because the natural interest rate is not directly observable, we must infer its value from the behaviour of market interest rates and other economic variables. We follow the approach proposed by Laubach and Williams (2003) and work with a semi-structural model that links the natural interest rate to the output gap and inflation.

Tailoring the approach to Chinese conditions

Applying the Laubach and Williams framework to Chinese data throws up a number of challenges. Chinese GDP growth varies little from quarter to quarter.1 And some key variables have relatively short data samples. For example, the one-year loan prime rate (LPR), a core policy instrument, did not exist until late 2013. Short samples and uninformative data make it hard to pin down variables such as the output gap, potential output growth or expected inflation. Without these, estimates of the natural interest rate lack credibility.

We overcome these challenges by making use of multiple data sources.2 For example, we use data on GDP, import values, railway traffic and electricity volumes to measure economic activity and both the consumer and producer price indexes to measure underlying inflation. Individually, each of these measures have drawbacks. Together, they shed considerable light on the Chinese business cycle and trends in the rates of economic growth and inflation.

The natural interest rate, output gap and potential growth

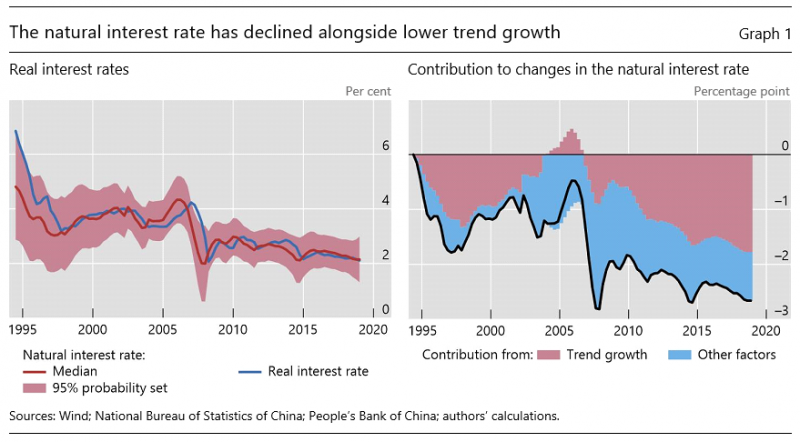
Our main result is that China’s natural interest rate averaged around 3-5 per cent between 1995 and 2010, but has declined more recently to be about 2 per cent as of the end of 2019 (Graph 1, left-hand panel). A bit over half of the decline in the natural interest rate was due to a reduction in potential output growth (right-hand panel). The rest reflects other factors, such as demographic changes, financial market development or shifts in saving preferences as incomes have risen. Assuming an annual inflation rate of 2-3 per cent, which is consistent with recent inflation outcomes and the inflation objective laid down by the National People’s Congress, our estimates imply a natural nominal interest rate of around 4-5 per cent.

 width=

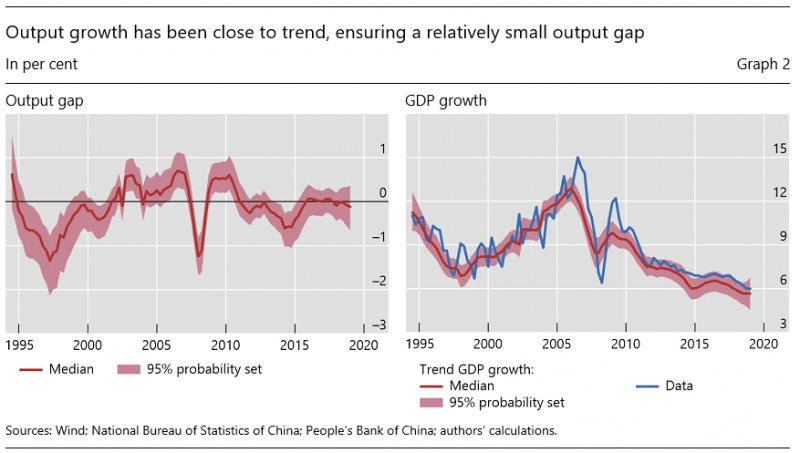
As well as the natural interest rate, we also estimate the output gap in China (Graph 2, left-hand panel). For the most part, our estimates correspond to standard accounts of Chinese economic developments. After experiencing a cyclical downturn in the late 1990s, economic activity in China picked up through the mid-to-late 2000s, likely supported by its entry to the WTO in 2001. Economic activity declined sharply during the Great Financial Crisis (GFC), with the output gap reaching -1%, although the downturn was extremely brief. Between 2012 and 2019, the output gap was close to zero, except for a small dip around 2015.

Consistent with the relatively small output gap, we estimate that actual GDP growth has tracked potential growth closely in recent decades (Graph 2, right-hand panel). Potential growth accelerated from around 7 per cent in the late 1990s to reach 12 per cent in 2006. Since then, it has gradually declined and at the end of 2019 was around 6 per cent.

 width=

Tracking the natural interest rate in real time

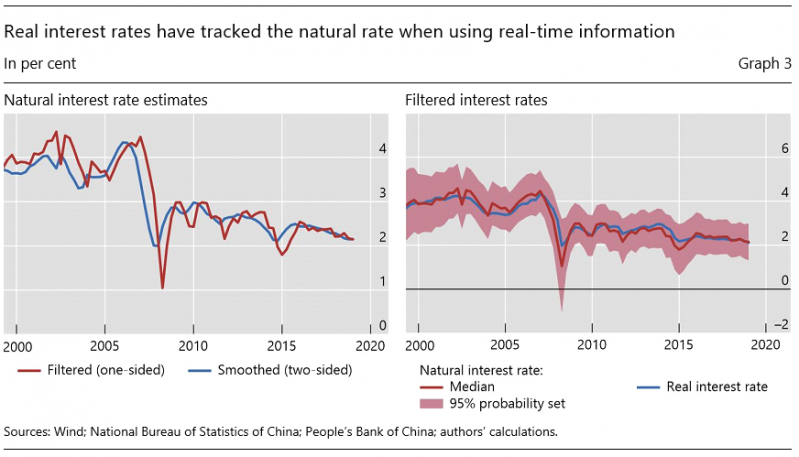
Because monetary policy affects the economy with a lag, natural interest rate estimates can be revised as new data becomes available. The results described above use information from the entire sample to estimate the natural rate. As such, they may overstate the predictability of the natural rate and understate the uncertainty around its level in real time. We can get a sense of this uncertainty by comparing these “full-sample” estimates of the natural rate to “real-time estimates” that use only past and current information to estimate the value of natural rate at each point in time (Graph 3, left-hand panel).3

Our model provides a good guide to China’s natural interest rate in real time. As one would expect, the “real-time” estimates lag the “full-sample” ones by a few quarters. For example, based on the full data sample, we estimate that China’s natural interest rate fell by a bit over a percentage point in 2008. But, with the information available at the time, this decline would not have been apparent until late 2009. On the whole, however, the pattern of the two series is similar. This is also the case for the model’s other key state variables, like the output gap, trend inflation and potential GDP growth.

The “real-time” estimates also shed light on the stance of monetary policy. Policymakers do not have the benefit of hindsight and must work with the information they have at hand. Consequently, “real-time” estimates arguably provide a better indication of the stance that policymakers were trying to achieve at any point in time. Indeed, when measured against the “real-time” estimates, we find that the ex-post real interest rate has tracked the natural interest rate closely, even though, based on the full sample, our results suggest that real interest rates have deviated from the natural rate from time-to-time (Graph 3, right-hand panel).

 width=

Conclusion

As the Chinese financial system evolves and its links with overseas economies intensifies, interest rate developments in China will assume increasing importance for macroeconomic conditions in China and globally. This creates a need for tools that can shed light on the stance of monetary policy in China, its links to cyclical developments and its medium-term anchors. The model described in this note helps to address this need by proposing a framework to estimate the natural rate of interest in China, as well as related concepts such as the output gap.

References

Kerola, E and B Mojon (2021): “What 31 provinces reveal about growth in China”, BIS Working Papers, no 925, January.

Laubach, T and J Williams (2003): “Measuring the Neutral interest rate”, Review of Economics and Statistics, vol 85, no 4, pp1063-70.

Sun, G and D Rees (2021): “The Natural Interest Rate in China”, BIS Working Papers, no 949, June.

  • 1.

    See Kerola and Mojon (2021) for a discussion of this issue.

  • 2.

    See Sun and Rees (2021) for a detailed explanation of our empirical approach, as well as additional results and analysis.

  • 3.

    To be precise, the “full-sample” estimates represent the smoothed, two-sided, estimates and the “real-time” estimates represent the filtered, one-sided, estimates. Both sets of estimates are based on the same data vintage and parameter estimates.

About the authors

Sun Guofeng

Sun Guofeng is Director General of the Monetary Policy Department of the People’s Bank of China. He was Director General of the Research Institute of the PBC and previously worked in the PBC’s monetary policy department, where he served as Deputy Director of Open Market Operations, Director of Foreign Exchange Operations and Deputy Director General of the Monetary Policy Department. Dr Sun was a visiting professor in the Economics Department of Princeton University, a visiting fellow at the Bank for International Settlement Bank and Stanford University. He is the author of Reforms in China’s Monetary Policy and Financial Reforms in Modern China.

Daniel Rees

Daniel Rees is a Principal Economist at the Bank for International Settlements, where he has worked since 2019. Prior to this, he was Head of Macoreconomic Modelling at the Reserve Bank of Australia. He received his PhD from MIT in 2013. His main research areas include macroeconomic modelling, international economics and the analysis of structural change. His research has been published in journals including the Journal of International Economics, Journal of Applied Econometrics and European Economic Review.

More on these topics

Tags: