Spending on food and housing prevented a more marked decline in household consumption. Looking at the composition of household consumption (Chart 2), it is clear that the resilience of consumption to the pandemic’s adverse impact was based on higher spending on food and housing, items satisfying essential basic needs. At the same time, businesses providing essential goods were least affected by the pandemic containment measures.
Chart 2: Composition of household consumption (annual percentage changes; percentage point contributions)
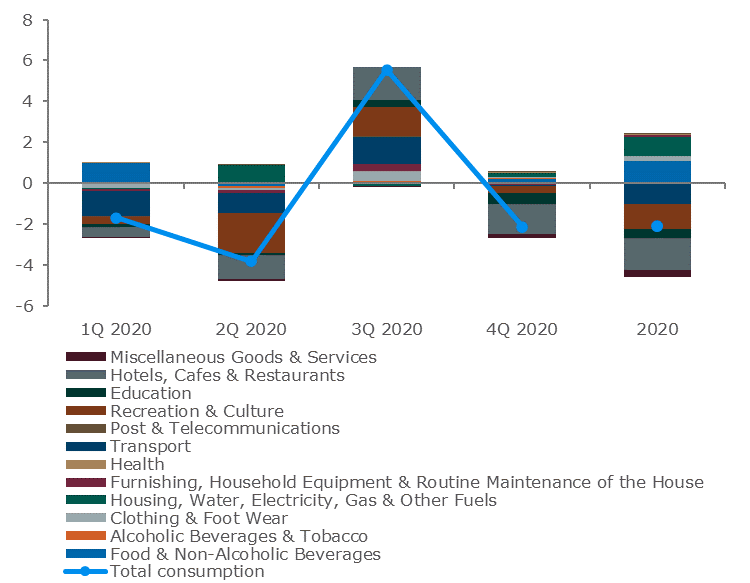
Sources: SO SR, and NBS calculations.
Note: At constant prices, seasonally adjusted, for the whole of 2020 – contributions to the cumulative change for all quarters.
Relative to their overall consumption, households in Slovakia spend more on basic necessities than do households in any other EU country. This different composition may provide one explanation for the more moderate decline in consumption observed in Slovakia. The share of food and housing in household consumption in Slovakia is the highest in the European Union. (Chart 3).
To investigate the nature of the consumption behaviour in Slovakia more formally, we took two standard models to Slovak data. First, we estimated many variants of a consumption function that connects consumption with different sources of income (labour, transfers and property), wealth (financial, non-financial) and a wide range of variables that would be expected to have mainly a short-term impact on consumption (interest rates, uncertainty, household indebtedness, unemployment, etc.). We estimated the model both including and then excluding data from 2020. This work followed closely the method applied in de Bondt et al. (2019).
In a separate estimation, following Mody et al. (2012), we analysed the relative importance of the propensity for forced saving and the propensity for precautionary saving in 2020. The forced saving rate is approximated by the Google mobility index for the retail and recreation category. As for precautionary savings, their usual proxy in the literature is the unemployment rate or unemployment expectations used in Bank of Slovenia (2020) or Dossche (2020). The proxy for precautionary savings was the unemployment gap (deviations of the actual unemployment rate from NAIRU). This is because consumer confidence survey data on unemployment expectations have for a long time moved in the opposite direction to the saving rate. This likely has structural roots unrelated to our analysis.
Chart 3: Basic necessities as a share of overall household consumption in 2019 (percentages)
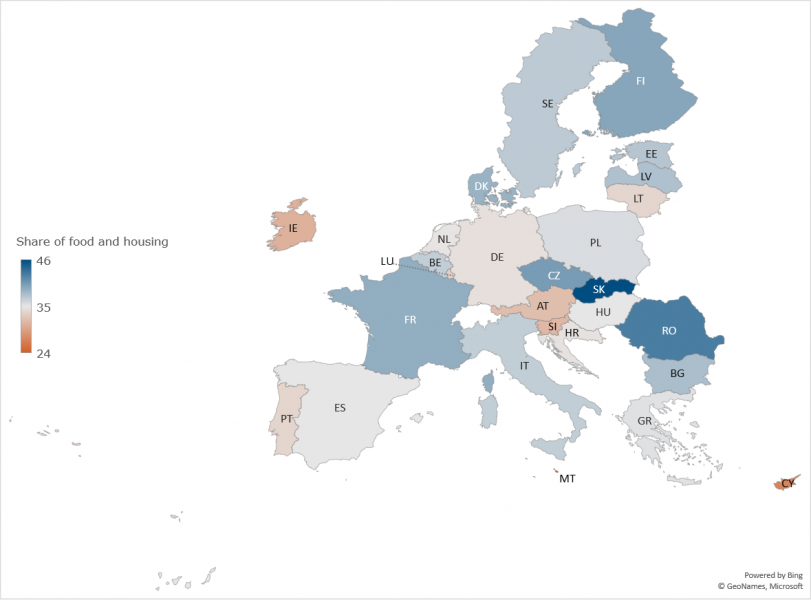
Source: Eurostat.
The onset of the pandemic in the first quarter of 2020 brought only slight changes in household behaviour. As their labour income decreased, households’ consumption fell only slightly below normal levels. Transfer income was having an increasing impact. The increase in pandemic-related payments of sickness allowance and carer’s allowance to some extent compensated for the decline in labour income.
The model’s predictive power weakened in the later quarters of 2020 (Chart 4). In the second quarter, the decline in actual consumption was somewhat greater than what model predictions would imply. Business closures resulted in an increase in forced savings, as they denied people opportunities to make purchases they otherwise would have made. Once the measures eased and businesses reopened, consumers released some of their pent-up demand. Hence the recovery in consumption in the third quarter was more pronounced than that implied by the model.
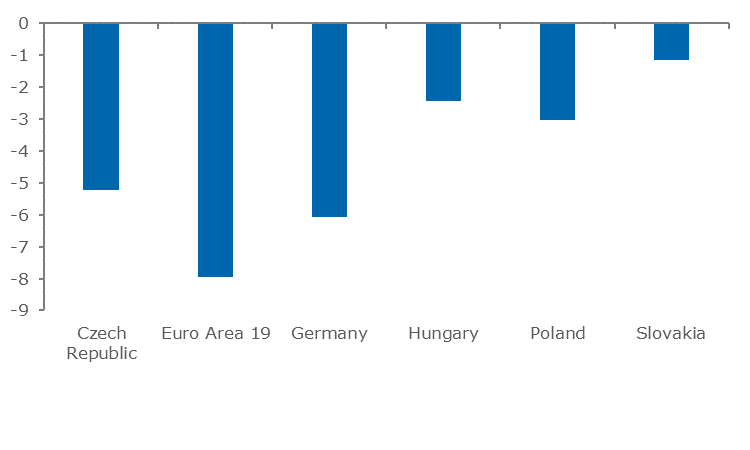
Until the third quarter, therefore, consumption was mirroring disposable income developments to an unprecedent extent. The result was a stable saving rate. Unlike in other EU countries, households in Slovakia were not saving more than they were before the pandemic. Slovak households used their resources to a greater extent for consumption, so the decline in consumption was more moderate than in neighbouring countries. By the end of the year, however, as a result of forced savings, a clear gap was appearing between model-estimated and actual household consumption (Chart 4). It was only in this latter part of the year that Slovakia’s household saving rate showed any sign of increasing (Chart 5).
Chart 4: Predictions versus actual data (annual percentage changes)
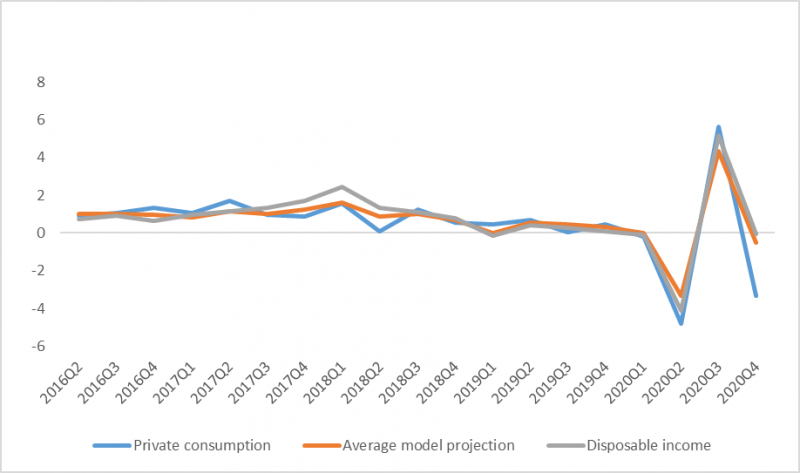
Sources: SO SR, and NBS calculations.
Note: Average model predictions – the average of one-step ahead predictions of the first 20 models.
The argument that emerges from the consumption function estimation is that the savings rate would have dropped and then slightly overshot normal levels before reverting towards normal at the end of the year, had there not been shop closures or social distancing.
Instead, the saving rate maintained a steady level until autumn 2020. These are levels somewhat elevated by historical standards mainly due to population ageing (Chart 5). In the pre-pandemic period, when unemployment was low, people were less concerned about income losses, the precautionary motive was weak which dragged the household saving rate down. After much of the economy was shut down because of pandemic containment measures in the spring, forced savings became the main driver of household savings growth, except during the temporary easing of measures in the third quarter. The saving rate increased sharply only during the last quarter of the year amid the pandemic’s second wave.
Chart 5: The saving rate and its main components (deviation from the mean in percentages; percentage points)
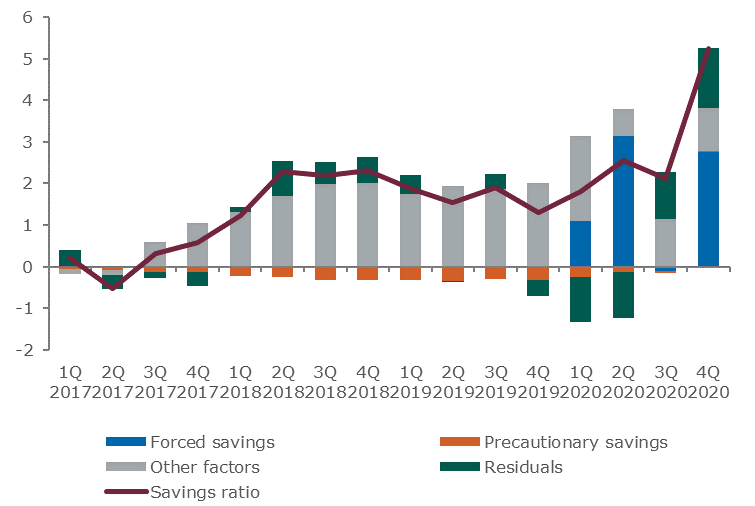
Source: NBS calculations.
Note: The data are adjusted for the mean for 2007 to 2020. In the case of the saving rate, the mean was almost 9%.
Despite the crisis, we see little evidence of increasing precautionary savings in 2020. Household concerns about employment loss may have been tempered by the government’s job retention measures. We see the model’s residuals increasing throughout 2020 which could be a sign of something else happening which our methodology and data have not been able to identify well. Overall, however, a combination of consumption smoothing and forced savings provides the best explanation of consumption resilience and moderate savings dynamics in Slovakia in 2020.
Dossche M., Zlatanos S. (2020) “COVID-19 and the increase in household savings: precautionary or forced?”, Economic Bulletin 6/2020, Box 5, European Central Bank
https://www.ecb.europa.eu/pub/pdf/ecbu/eb202006.en.pdf
Economic and Monetary Developments (2021) “The pandemic year from a consumer behaviour perspective”, National Bank of Slovakia, Spring 2021
https://www.nbs.sk/_img/Documents/_Publikacie/ekonomicky_menovy_vyvoj/2021/EN/emd_spring-2021.pdf
Macroeconomic Projections for Slovenia (2020) “Household savings ratio: drivers and projections”, Bank of Slovenia, December 2020
https://bankaslovenije.blob.core.windows.net/publication-files/macroeconomic-projections-for-slovenia-december-2020.pdf
Mody A., Ohnsorge F., Sandri D. (2012) “Precautionary Savings in the Great Recession”, IMF Working Paper WP/12/42
https://www.imf.org/-/media/Websites/IMF/imported-full-text-pdf/external/pubs/ft/wp/2012/_wp1242.ashx
de Bondt, G., Gieseck, A., Herrero, P., Zekaite, Z. (2019) “Disaggregate income and wealth effects in the largest euro area countries“, ECB Working paper series No 2343, December 2019
https://www.ecb.europa.eu/pub/pdf/scpwps/ecb.wp2343~8a1d3cdd68.en.pdf?4cbcdc3dd55c441fe6441315ebfd9f4a
Senaj, M. (2007) „Odhad spotrebnej funkcie pre Slovensko a prognóza spotreby“, NBS, Výskumná štúdia 1/2007, Júl 2007
https://www.nbs.sk/_img/Documents/PUBLIK/07_sen1.pdf