Disclaimer: The views expressed herein are those of the authors and do not necessarily reflect the position of the Banque de France. Any errors or omissions are the responsibility of the authors.
Monetary policy tightening is expected to render financing conditions restrictive and lead to a reduction in excess demand, thus relaxing price pressures. In this analysis, we assess the transmission of the tightening of monetary policy to financing conditions. To this end, we rely on a new aggregate indicator of financing conditions, as well as an original indicator of policy stance including both conventional and unconventional measures. We find the pass-through in 2022-2023 to be close in the Euro area and the US, and similar to previous cycles. Roughly half of the change in monetary stance is expected to eventually be passed on to financing conditions, with most of this transmission occurring during the first year.
Following the spike of inflation in the post-Covid era, most central banks around the world have reversed since 2022 the exceptional monetary easing policies implemented during the Covid crisis and engaged in monetary tightening. They have generally relied on both interest rate increases and quantitative tightening. The ECB started its normalization process in July 2022. Up to November 2023, it has increased its policy rate by a total of +450 bp and reduced the size of its balance sheet by close to 900 billion EUR. The Federal Reserve started slightly earlier, in March 2022. Since, it has increased the Fed funds rate nine times for a total of 550 bp and reduced its balance sheet by close to 1 100 billions USD. Such a fast rate increase has only occurred in the early ‘80s and the Fed funds rate has reached its highest level since 2007.
Monetary tightening should render financing conditions restrictive, leading to a reduction in excess aggregate demand and eventually to declining price pressures. The aim of this study is to evaluate the first stage of the monetary transmission mechanism, i.e. from monetary policy to financing conditions to the non-financial sector. Additionally, we also seek to compare the transmission during the current tightening cycle in 2022-2023 with previous cycles, both across the Euro area and the US.
To this end, we construct a synthetic indicator of financing conditions to the real economy, aggregating both bank lending rates and market yields. We rely on this indicator to estimate the pass-through of monetary policy tightening to financing conditions, both in terms of long run equilibrium and speed of adjustment. Finally, we give an estimate of the remaining pass-through in the pipeline.
We find the pass-through to be rather similar in the Euro area and the US, with roughly half of the change in monetary policy that is expected to be transmitted to financing conditions in the long run. Moreover, the transmission appears rather fast, with most of the expected pass-through to be completed within a year. The transmission during this cycle of 2022-2023 is actually similar to the previous tightening cycles – 2005 for the Euro area and 2015-2018 for the US.
We conclude that most of the monetary policy tightening has already transmitted to lending rates and yields and little is still to come in the pipeline. As a consequence, further analysis should focus on the second stage of the transmission mechanism, that is the reaction of financing flows, aggregate demand and eventually inflation to changes in financing conditions.
Policy rates are key determinants of bank retail rates, as a proxy for banks’ marginal cost of funding. However, bank lending rates are known to adjust only partially to policy rates (Levieuge & Sahuc, 2021, Byrne & Foster, 2024). Overall, the literature shows that their reaction is generally sluggish in the short run and incomplete over the longer term, mainly due to different market frictions (De Bondt, 2005). For instance, imperfect competition has a negative impact on the speed and extent at which banks adjust their lending rates following changes in the monetary policy stance (Kopecky & Van Hoose, 2012). Similarly, by isolating the borrowers from volatile financing conditions, long-term relationships between banks and their customers dampen the pass-through (Allen & Gale, 2004). In addition, banks with a highly diversified portfolio of activities may be less sensitive to movements in policy rates. The same prevails for those banks that have a large deposit base (Berlin & Mester, 1999). Last, in case of credit rationing, banks tend to restrict lending to riskier borrowers rather than adjusting the cost of credit (Stiglitz & Weiss, 1981).
Beyond bank lending rates, the stance of monetary policy also influences the conditions under which non-financial companies and the government raise funds on capital markets. In the wake of a restrictive monetary policy, companies issuing bonds have to offer higher interest rates to attract investors. In addition, higher returns on monetary assets can reduce demand for corporate bonds, driving down the price of existing securities. This ultimately increases the bonds’ yield-to-maturity, which acts as a benchmark for new issuance. In addition, a rise in perceived risk may lead to a flight-to-quality mechanism that is conducive of higher rates.
Finally, the cost of government debt specifically is also influenced by the stance of monetary policy. In theory, the interest rate on a sovereign bond is equal to the average of expected short-term interest rates up to maturity, marked-up by a liquidity premium and a risk premium. Central bank credibility and communication of monetary policy actions are crucial to make this transmission more effective. The sovereign rates also depend on past (stock effect) and current (flow effect) unconventional monetary policy measures. Therefore, the stance of monetary policy should not be assessed solely in terms of policy rates, but also in the light of unconventional measures.
As monetary policy combines both conventional and unconventional measures, relying only on key policy rates to gauge the monetary policy stance would be inadequate. Financing conditions respond to policy rate movements, but also to balance sheet measures and forward guidance. Therefore, we rely on a “proxy rate”, following the approach of Choi et al. (2022), as an alternative to the policy rate, to capture the monetary policy stance. This indicator assumes that market interest rates have a common component driven by – both conventional and unconventional – monetary policy. Precisely, the proxy rate is based on a principal component analysis extracting common movements among a set of interest rates and spreads. As such, it can be viewed as the policy rate that would typically be associated with prevailing market rates and spreads, had the policy rate been the only monetary policy tool being used.
The evolution of this proxy rate for the Euro area and the US1 is shown by dotted lines in Figure 1.
Figure 1: FingCI and policy rates EA and US (%)
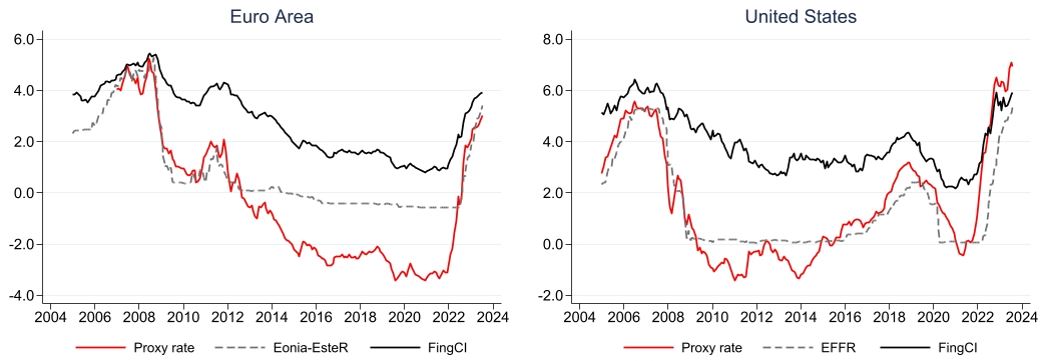
Source: Banque de France, European Central Bank, Federal Reserve Bank of San Francisco, Federal Reserve Bank Board.
Interestingly, we note that the proxy rate has increased already a few months before the official monetary policy tightening. It was in January 2022 for the Euro area, hence six months before the first rise in Eonia, and as early as June 2021 for the US, whereas the first hike in the Fed Funds rate only occurred in March 2022. This can be explained by central banks’ announcement effects and credibility, such that the tightening of monetary policy was anticipated as inflation expectations were mounting. As such, according to the proxy rate, the start of the most recent monetary tightening cycle should be in January 2022 in the Euro area, and June 2022 for the US. Moreover, monetary policy has tightened more in the US than in the EA. Up to August 2023, the proxy rate has increased more than 7.5 pp in the US, compared to 6 pp in the Euro area.
Our assessment of monetary policy pass-through to financing conditions is based on a synthetic index of financing conditions, labelled FingCI.2 We compute the index as a weighted average of several interest rates on newly contracted debt by non-financial agents (households, corporates and the government). The weighs used for the construction of FingCI are fixed and correspond to the relative importance of each type of debt in the total stock of non-financial sector debt, as observed in January 2020. Details of the interest rates and weights are presented in Table A1 in appendix. Movements in the FingCI are due solely to variations in the interest rates and not changes in the debt structure. As such, the index can be viewed as the marginal cost of financing, for a given debt structure.
The dark solid line in the left panel of Figure 1 shows the evolution of the FingCI in the Euro area since 2004. We observe different phases:
The US, in the right panel of Figure 1, follows an overall similar pattern, with some specificities:
Visually inspecting the evolution of the FingCI indicator against the monetary policy stance can give us an indication as to the transmission of monetary policy to financing conditions. Figure 2 illustrates the joint evolution of the proxy rate and the FingCI in the Euro area and the US. The closest the curves to 45-degrees dotted line (corresponding to a full pass-through), the more complete the policy transmission. In addition, the steeper the slope of the curves connecting two or more scatter points, the faster the transmission.
Figure 2: Evolution of the FingCI relative to the monetary policy stance
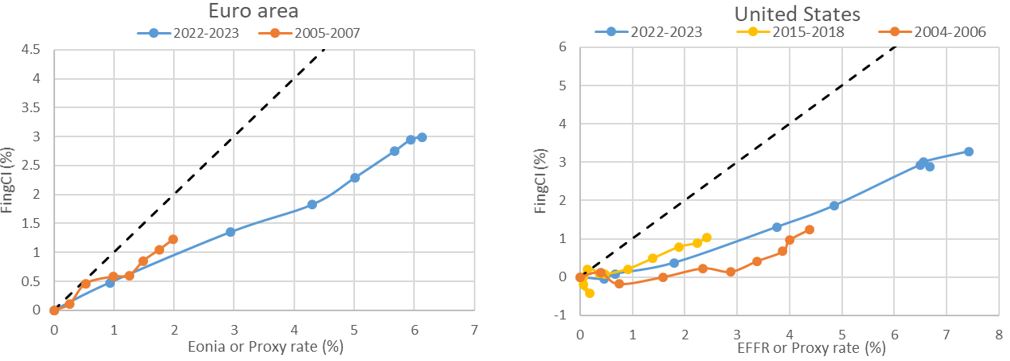
Source: Banque de France, European Central Bank, Federal Reserve Bank of San Francisco, Federal Reserve Bank Board.
Note: charts plot the change in the FingCI (y-axis) relative to the change in the monetary policy stance (x-axis), starting from the beginning of the tightening cycles. We measure the monetary policy stance with Eonia and EFFR for the 2004-2007, and the proxy rate for 2015-2018 and 2002-2023. The 45° black dotted line represents a 1:1 transmission i.e. a 100% pass-through.
According to the left-hand plot of Figure 2, as expected the EA FingCI has increased following the rising proxy rate, but less than proportionally, thus suggesting an incomplete pass-through. Regarding the main components of the FingCI (see Fig. A1 in Appendix), it appears that market rates, i.e. the corporate and sovereign yields, have more strongly reacted to the monetary tightening, especially in the beginning of the cycle. The transmission to bank lending rates to firms and households, which are usually known to adjust slower than market rates (see, e.g. Lane, 2022), appears to be lower. For a historical comparison, Figure 2 also shows these evolutions during the past tightening cycle starting in December 2005 (unconventional measures were absent at the time and the Eonia was thus representative of the monetary stance). Overall, it appears that the current pass-through is not stronger than in the past. The FingCI even seems to be a little closer to the first bisector than it is in the current cycle. Hence, the significant tightening of financing conditions in the Euro area during the current cycle reflects the unprecedented speed and magnitude of monetary policy tightening.
The right-hand side plot of Figure 2 shows that the evolution of the FingCI relative to the monetary policy stance is rather similar in the US. We can observe three tightening cycles in the US since 2004. Monetary policy transmission during the 2022-2023 cycle appears similar to the previous cycle in 2015-2018 (roughly speaking, the slope of the two curves is similar). For the same change in the policy stance, the transmission to financing conditions is not faster this time compared to 2015-2018. However, transmission during the 2004-2006 cycle runs lower, suggesting that, before the GFC, financing conditions adjusted relatively less to monetary policy tightening. As for the Euro area, Figure A1 in Appendix illustrates the transmission to the specific lending rates and yields composing the aggregate FingCI in the US during 2022-2023. Overall, interest rates react rather similarly to the tightening of the monetary policy stance. Bank lending rate to firms seems to have adjusted only late in the cycle through.
While instructive, such a graphical analysis does not give a clear picture of the completeness of the pass-through, the speed of adjustment or the remaining pass-through in the pipeline. However, these can be formally estimated in an empirical setting, outlined in the next section.
In order to evaluate the extent to which financing conditions adjust to monetary policy tightening, we estimate the pass-through of the proxy rate to the FingCI indicator based on ARDL models (Auto-regressive distributed lags models, see Appendix for technical details). Such a model allows us to estimate the extent of long-run adjustment of lending rates and yields to changes in the proxy rate – called completeness. Also, ARDL models allow us to evaluate the time needed to reach this long run pass-through, or the speed of adjustment. Finally, based on these estimates, we are able to give an indication of the “remaining pass-through” in the pipeline, defined as the expected change to come in lending rates and yields, given past monetary policy impulses and the expected long run pass-through.
We illustrate in Figure 3 the adjustment path towards the long-run pass-through, both for the EA and the US (technical details are provided in Appendix). Overall, the speed of transmission from the proxy rate to lending rates and yields appears rapid. For the EA during the 2022-2023 tightening cycle (blue bars in the left panel), 50% of the expected pass-through is completed within the first 3 months after the initial tightening and 80% is reached with the first 6 months. A year later, the expected pass-through towards the long-run target is almost fully completed. For the US (right panel), transmission is also fast, but slightly less than for the EA: 40% of the expected pass-through is completed within the first 3 months and 60% in the first 6 months. A year later, the expected pass-through in the US is close to completion. Looking at the pass-through to the specific interest rates composing the FingCI in the EA (Figure A2 in appendix), we note, as in the literature, a more rapid transmission to market rates than to bank lending rates.
Figure 3: Estimated pass-through to financing conditions (FingCI)
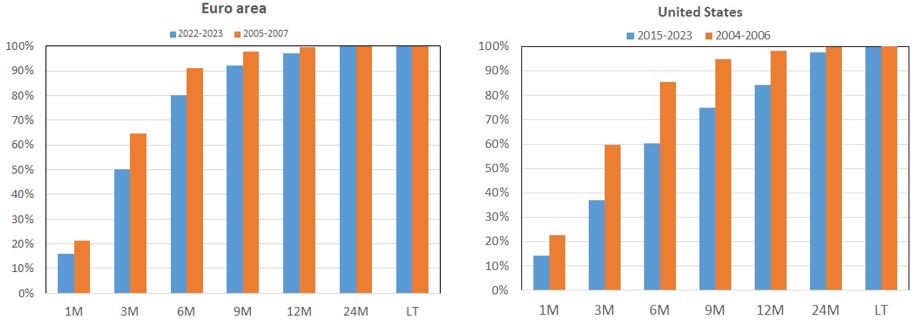
Note: This figure represents the transmission completed each month, in % of total expected transmission in the long run.
When comparing several tightening cycles, the speed of transmission appears similar in the EA between the current cycle and one in the mid-2000s (blue and orange bars in Figure 3). For the US though, monetary transmission appears slightly slower compared to the mid-2000s. The main difference between the US and the EA seems to arise from the lower response of US long rates, namely the sovereign yield and the mortgage rates (which count for a large share in the FingCI). While the yield curve tends to flatten with the strength of monetary tightening, it has even become inverted during the 2022-2023 tightening cycle3 (Figure A3 in appendix). Indeed, the rapid tightening of monetary policy in 2022 has spurred concerns about a future recession4 down the way in the US, leading market participants to anticipate a reversal of the monetary stance. Adversely, the long-term interest rate in the EA has increased steadily throughout 2022-2023, with the yield curve showing signs of inversion only in recent months.
It is important to note that this adjustment, though rapid, applies to a long-term pass-through that is incomplete – that is the total variation in the policy rate is never fully transmitted to the cost of lending. As such, our estimates of completeness (provided in Table A2 in Appendix) predict that roughly half of the total change in the proxy rate is eventually transmitted to financing conditions in both the EA and the US in the long run. The completeness of the pass-through in the EA appears somewhat lower compared to the mid-2000s (49% vs 68%), consistent with Figure 2. Adversely, in the US it is slightly higher in 2022-2023 compared to the mid-2000s.
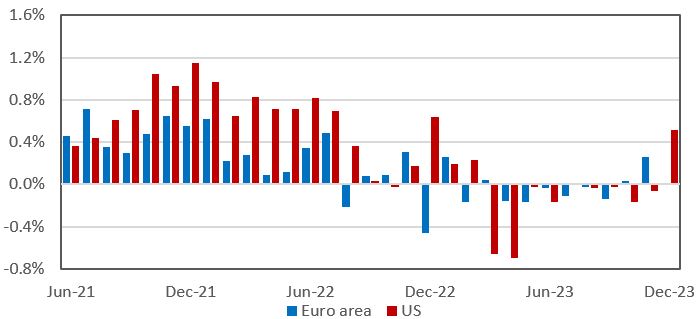
Figure 4: What is left in the pipeline? (in pp, as of September 2023)
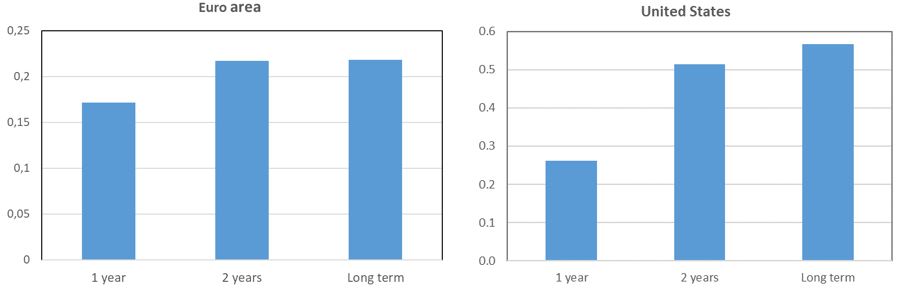
Note: The remaining pass-through in the pipeline is computed based on the expected long run pass-through obtained from ARDL estimations, and the observed changes in the Proxy funds rate during 2022-2023.
Last, what is left in the pipeline? Given the cumulative changes in the proxy rate since 2022, and the estimated long-run pass-through to financing conditions (in terms of speed and completeness), we are able to compute the “remaining pass-through in the pipeline”. Figure 4 illustrates this “remaining pass-through” for the next one year, two years and the long run, as of September 2023. In the absence of further tightening, the EA FingCI can be expected to increase around an additional 17 bps in one year and 22 bps in two years. Given the relative high speed of adjustment, the latter roughly coincides with the total tightening expected in the long run. For the US, the expected increase in FingCI should be around 25 bps in one-year, 50 bps in two years and close to 60 bps in the long run. Overall, we conclude that the remaining tightening in the pipeline is small for both regions. The US still has relatively more tightening to come, as the adjustment to the long run equilibrium is slower, as we have previously seen, but also because the tightening in the monetary policy stance has been relatively stronger.
Finally, despite the relatively fast adjustment of financing conditions to policy tightening, credit volumes have not yet contracted massively (Figure A4 in appendix). Aggregate demand appears rather resilient for in the US, while the outlook is less bright in the Euro area. However, bank lending surveys show that loan demand has bottomed out on the two sides of the Atlantic since mid-2023 and recovery is under way.
This policy note assesses the monetary policy tightening during 2022-2023 and its transmission to financing conditions in the EA and the US. This analysis may provide some guidance for policy makers facing today’s question of whether to continue tightening or wait for the effects of past tightening to materialize.
We first construct and indicator of financing conditions as a weighted average of different lending rates and market yields. Second, we investigate its response to the tightening of the monetary policy stance during 2022-2023 and compare that with previous tightening cycles.
The current tightening of monetary policy has been unprecedented, both in terms of speed and total rate increases. This may lead to an impression of fast transmission to borrowers’ interest rates. However, the transmission to overall financing conditions appears similar to the previous cycle, with a long run pass-through of around 50%, slightly lower in the Euro area compared to the US. Also, the transmission is not faster compared to the past, and may even be slower in the US, due to the inversion of the yield curve.
Our analysis based on ARDL models suggests that most of the monetary tightening operated in 2022-2023 has already transmitted to lending rates and yields. Moreover, little is still to come in the pipeline and financing conditions should not tighten much more in the absence of further policy tightening.
While the transmission from monetary policy to financing conditions has operated rather smoothly, uncertainty remains as to the transmission from financing conditions to credit volume (see Fig. A5) and aggregate demand. In fact, aggregate demand appears rather resilient for now, given all the tightening already operated. This suggests transmission lags to the real economy may be longer or the economy may be potentially less responsive to interest rates. Furthermore, bringing inflation back to the target will ultimately depend on the response of inflation to changes in aggregate demand, according to the slope of the Phillips curve.
Table A1: Interest rates and weights used for the construction of the FingCI index
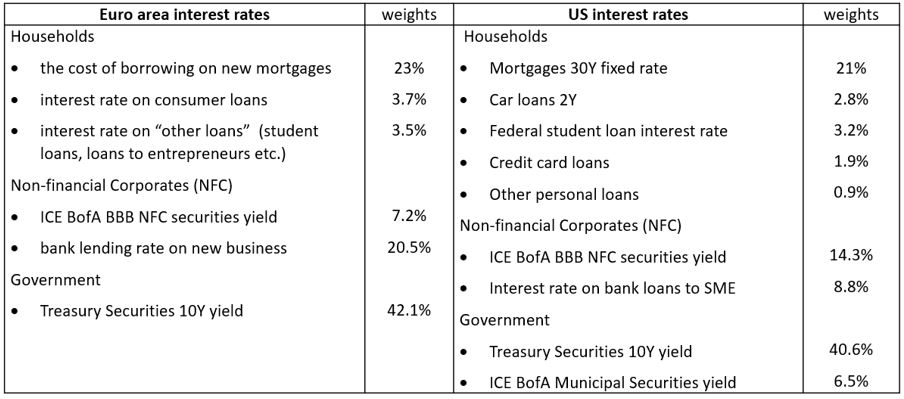
Source: ECB SDW, Fed, Bank of America Merrill Lynch. Weights represent shares in total stock of non-financial debt as of January 2020.
Figure A1: Evolution of FingCI (and main components) relative to the proxy rate 2022-2023
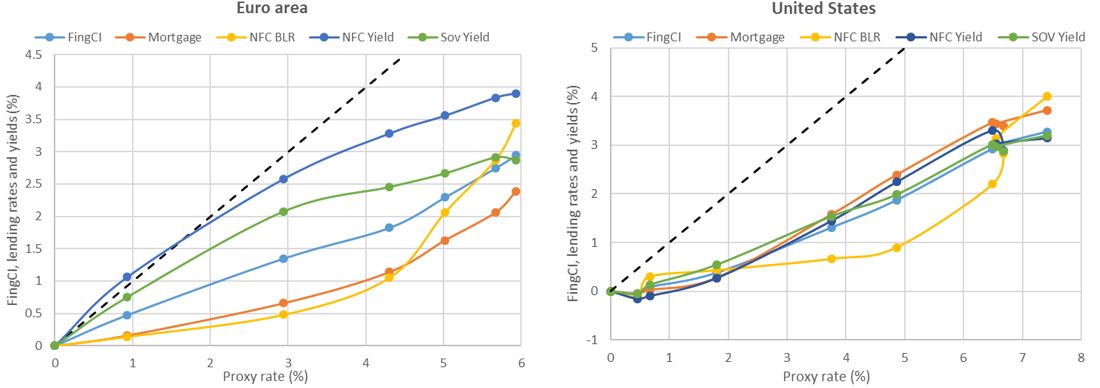
Table A2: Estimated degree of completeness of the pass-through from the proxy rate to FingCI
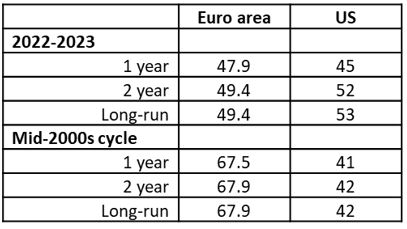
Note: Figures represent the estimated long-term pass-through of the proxy rate to financing conditions, i.e. completeness. “Mid-2000s” tightening cycle corresponds to 2005-2007 for the EA and 2004-2006 for the US.
Figure A2: Estimated path-through to the main components of FingCI (2022-2023)
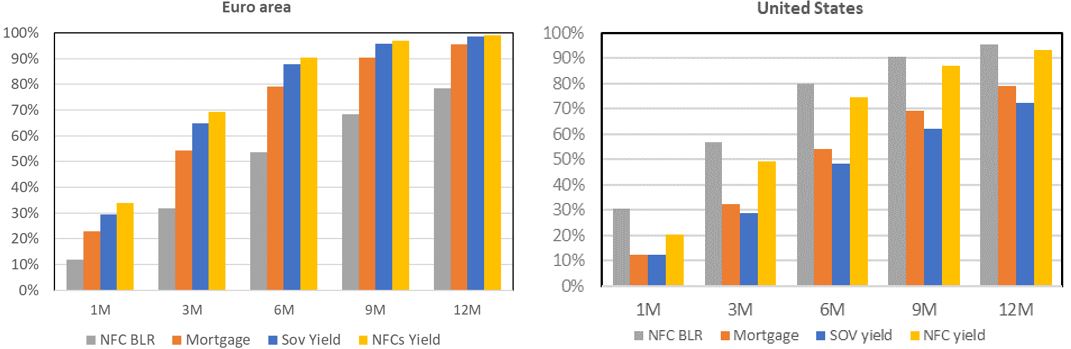
Figure A3: Policy rate and the yield curve
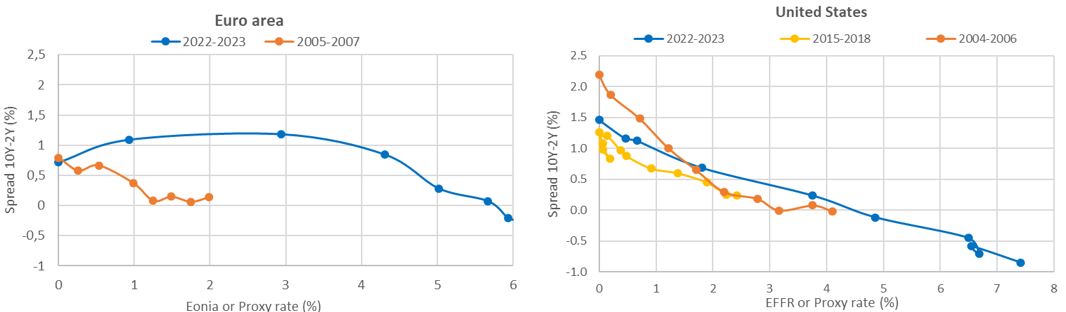
Source: BdF,ECB, Fed. Note: these charts plot the change in the term spread (10Y-2Y) relative to the change in the monetary policy stance as given by the proxy rate or the Eonia/EFFR policy rates (x-axis), since the start of the tightening cycles (Nov 2005, Dec. 2021 for the EA, and May 2004, Nov 2015 and May 2021 for the US).
Figure A4: Credit to the economy (m.o.m change)
Source: ECB for credit to residents in the EA, Fed for total credit from commercial banks in the US. The contraction in credit for the US in March-April 2023 represents an idiosyncratic factor due to the failure of SVB and Signature banks.
It is usual to assess the pass-through of monetary policy on interest rates based on autoregressive distributed lags (ARDL) models including an error correction term, such as:

We rely on the proxy rate as a measure of the policy rate, and on the FingCI indicator as an aggregate measure of financing conditions (including both interest rates and yields).
According to the two first terms, this model states that the evolution of the FingCI is influenced by its own past changes and by the past evolutions of the policy rate. In addition, the evolution of the FingCI depends on an error correction term defined as FingCIt-1-(βPolicyrate t-1+c), with c a constant. This error correction term implies that the level of FingCI converges towards a long-run benchmark, which is defined by the policy rate. The higher β, the stronger the long-run completeness of the convergence of FingCI to the stance of monetary policy. In addition, the higher λ, the faster this convergence. When the level of FingCI is above (below) its long-term target defined by (βPolicyrate+c), this convergence exerts downward (upward) pressure on the FingCI variation (∆FingCI).
Hence, in the long run:
Conditional on any given variation in the policy rate over the cycle, this relationship sets the level towards which the FingCI is expected to converge.
The orders p and q in the ARDL (p,q) are chosen according to the BIC information criteria. These orders are adjusted and sometimes augmented in order to ensure white noise residuals, according to the Breusch–Godfrey LM test for autocorrelation.
Allen, F., Gale, D., 2004. Financial intermediaries and markets. Econometrica, vol. 72 (4), 1032–1061.
Berlin, M., L. Mester (1999): Deposits and relationship lending. Review of Financial Studies, vol. 12 (3), 579–607.
Byrne D. and S. Foster (2024): Transmission of monetary policy: Bank interest rate pass-through in the euro area, SUERF Policy Brief, No. 771, January.
Choi, J., T. Doh, A. Foerster and Z. Martinez (2022). “Monetary Policy Stance Is Tighter than Federal Funds Rate.” FRBSF Economic Letter 2022-30 (November 7).
de Bondt, G., 2005. Interest rate pass-through: empirical results for the euro area. German Economic Review, vol. 6, 37–78.
Kopecky K., D. Van Hoose (2012): Imperfect Competition in Bank Retail Markets, Deposit and Loan Rate Dynamics, and Incomplete Pass Through, Journal of Money, Credit and Banking, vol. 44(6), 1185-1205.
Lane, P. (2022). The transmission of monetary policy. Speech at the 7th SUERF – CGEG – Columbia – SIPA – EIB – Société Générale Conference on “EU and US Perspectives: New Directions for Economic Policy”, New York City, 11 October.
Levieuge, G. and J-G. Sahuc (2021): Downward interest rate rigidity, European Economic Review, 137(C).
Stiglitz, J. and A. Weiss (1981): Credit rationing in markets with imperfect information, American Economic Review, vol. 71 (3), 393–410.
The proxy rate for the US is provided by the Federal Reserve Bank of San Francisco, based on Choi et al. (2022). The proxy rate for the Euro area is computed by Banque de France using a similar methodology.
Note that since the GFC, many institutions have proposed Financial Conditions Indicators (FCIs), defined as a weighted average of a multitude of asset prices (equity prices, exchange rates, spreads, sovereign rates, asset price volatility, etc.). Unlike the FingCI, which measures the marginal cost of debt, a FCI is rather a measure of financial conjuncture. Its interpretation is more vague, with no direct link to financing conditions and therefore to agents’ spending behavior.
The long run rates have increasing significantly in the US since August 2023, but the 10Y-2Y spread has remained negative, though to a smaller extent.
Monetary policy tightening, if seen by the markets as too strict, can generate expectations of future easing. The same is true if the tightening is expected to be short-lived, or to be ending soon.