To what extent can the basics of supply and demand help to explain the high rates of inflation in Ireland since 2021? In this analysis, we examine the data using a simple model-based approach and find that, on average, supply-side drivers explain around three fifths of inflation in the year to May 2023, while demand-side factors account for over one third of inflation. The decline in headline inflation since Q3 2022 has been mostly driven by an easing of supply-side inflationary pressures. The contribution of demand to core inflation appears to have faded over the last 12 months. Nevertheless, demand has become a more important driver of services inflation recently – consistent with signs of stronger domestic inflationary pressures.
Consumer price inflation in Ireland accelerated sharply from the second half of 2021 and into 2022. By June 2022, inflation as measured by the Harmonised Index of Consumer Prices (HICP) peaked at 9.6 per cent, a level of inflation not previously seen since the early 1980s. Both demand and supply factors played a role in the rise and subsequent fall in inflation since 2021. This can be partially observed in the simple decomposition of headline inflation shown in Figure 1. For example, Russia’s invasion of Ukraine in February 2022 led to enormous increases in energy prices, which had already been rising from late 2021, implying an important role for supply-side factors in driving the rise in overall inflation from the first quarter of 2022.
To more precisely decipher the contributions of demand and supply factors to inflation in Ireland, our analysis uses the decomposition based on Shapiro (2022) for the US and later applied to the euro area by Gonçalves & Koester, (2022). In a simple demand-supply framework, supply shifts move prices and quantities in opposite directions along a downward-sloping demand curve, while demand shifts move prices and quantities in the same direction along an upward-sloping supply curve. The ability to correctly identify demand and supply contributions based on this methodology relies on the quality of the price-quantity pairings. Since exact pairings are not available for all HICP components, there is a degree of measurement error with this approach that should be considered in interpreting the results.
Figure 1: Contributions to Year-on-Year change in Headline HICP Inflation
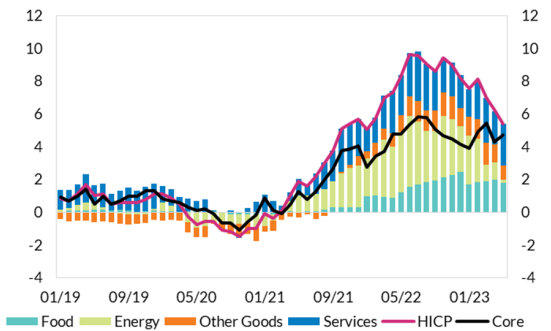
Source: Author’s Calculations, Eurostat.
Decomposing inflation into demand and supply drivers can provide useful information on the possible persistence of inflation and can help signal whether evidence of second-round inflationary pressures may be emerging. Furthermore, since monetary policy is transmitted predominantly via the demand channel, understanding the supply and demand drivers of inflation is important.
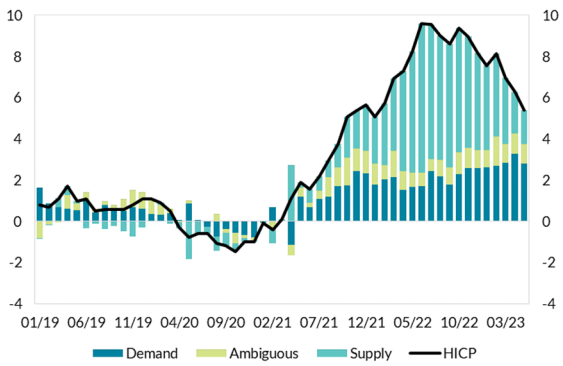
Figure 2 shows the decomposition of headline HICP inflation through to May 2023. At the onset of the pandemic, both weak demand and (excess) supply contributed to disinflation. After the re-opening of the economy during 2021, a resurgence in demand combined with supply chain restrictions affecting some sectors of the economy that had been closed during the pandemic led to a surge of inflation.1 From the start of 2022 however, most of the increase in headline inflation came from the supply shock resulting from the Russian invasion of Ukraine and its impact on energy prices. As global commodity prices eased thereby reducing supply side pressures, the contribution of demand-side factors to headline inflation increased during the second half of 2022. From our estimation, this shows up in particular in increased demand for transport. Looking at the more recent period, the decline in headline inflation since its peak in June 2022 up to May 2023 reflects an easing of price pressures predominantly from supply-side channels.
Figure 2: Decomposition of HICP inflation in Ireland
Source: Author’s Calculations, Eurostat.
Note: Seasonally adjusted data used. Based on the approach developed by Adam Shapiro. Here HICP inflation is calculated as the sum of demand-driven, supply-driven and ambiguous components of inflation.
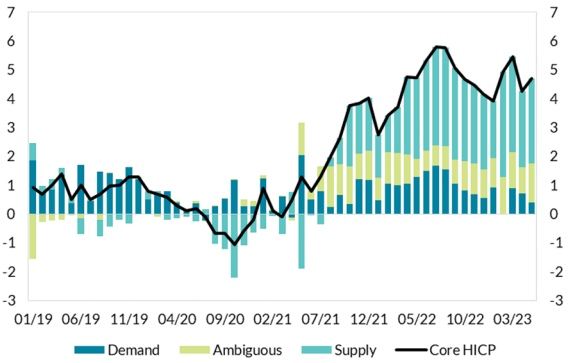
Next, we strip out the more volatile elements of inflation (food and energy) and decompose the demand-supply components of core inflation (Figure 3). The results suggest slightly different relative roles for supply and demand factors than was the case for headline inflation. After the re-opening of the economy, supply chain pressures from the goods side of the economy, such as furniture and household equipment, resulted in most of the initial increase in inflation, with demand for restaurants and hotels, transport services and housing also playing a role during this period. From the start of 2022, however, most of the surge in core inflation came from indirect effects on other non-energy prices of the initial energy-related supply shock following the Russian invasion of Ukraine. Sectors such as restaurants and hotels added significantly to supply-side inflation during this period, whereas demand factors have been less pronounced.
Core inflation has remained elevated over the five months of 2023 as shown in Figure 3, and continues to be driven by supply channels more than demand. The overall contribution of demand-side factors to core inflation eased slightly in the period up to May 2023 reflecting a number of offsetting developments. The contribution of demand to goods inflation excluding energy and food items reduced, more than offsetting a somewhat increasing role for demand in services inflation up to May 2023. In terms of supply, in the past four months over two percentage points were added to core inflation on the supply side due mostly to transport services and to a lesser extent recreation and communications. This is an important driver of the persistent supply contribution to core HICP up to May 2023.
Figure 3: Decomposition of CORE HICP inflation in Ireland
Source: Author’s Calculations, Eurostat.
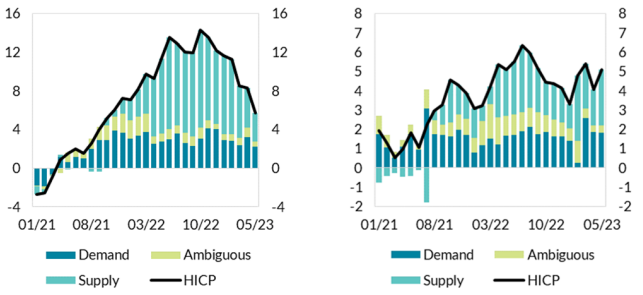
Figure 4 shows the demand-supply decomposition for goods (left panel) and services (right panel) inflation. Up to the end of 2021, demand outweighed supply as the main driver of goods inflation, with strong demand in sectors such as telecommunications, clothing, transport fuels, and some health products fuelling inflation. From the onset of the war in early-2022, supply-side factors took hold, with food, furnishings, and energy pushing up goods inflation. The introduction of minimum alcohol pricing also added to the increase in price levels via base effects over the period. The estimates indicate that the effect of demand on goods inflation is broadly unchanged since mid-2022. While the impact of supply factors on goods inflation has reduced in 2023 compared to 2022, the majority of goods inflation continues to be driven by supply-side effects up to May 2023.
In many respects, the narrative around the decomposition of services inflation is similar to that for goods. Services inflation in Ireland typically reflects more domestically-driven inflation (Bermingham et al, 2012; Gerlach et al, 2015; Byrne and Zakipour-Saber, 2020; Faubert, 2021; & Byrne, McLaughlin and O’Brien, 2022). Therefore, one might expect to observe stronger evidence of possible second round effects via the services channel. Demand explains most of the initial rise in services inflation, with restaurants and hotels, housing, and transport services all playing a role. Supply factors began to dominate services inflation after Russia’s invasion of Ukraine however. As with goods, supply dynamics remain the most prominent factors in explaining services inflation in the year to date, explaining over half of all services inflation in 2023.
At the same time, it is notable that the contribution of demand-side drivers to overall services inflation has picked up somewhat in recent months, with restaurants/ hotels and housing having a prominent role. This is consistent with a rise in domestic inflationary pressures. As the initial energy shock has faded, services inflation appears to be arising as a result of second-round effects from increased demand in recent months, as well as a persistent contribution from the supply side. This could indicate pass through of higher wages to domestic inflation in the services sector, giving rise to demand driven inflation; as well as cost-push factors such as firms maintaining or increasing their mark-ups, resulting in supply side inflation.
| Figure 4A: Decomposition of Goods inflation | Figure 4B: Decomposition of Services inflation |
Source: Author’s Calculations, Eurostat.
Overall, our analysis shows that the surge in inflation in 2022 mainly arose from the supply channel, and supply-side factors continue to have a pronounced effect on inflation into early 2023. While energy-related price increases played a key role in the initial rise in supply-driven inflation in 2022, domestic factors have become a more important driver of inflation over time. Demand-side channels continue to exert an important influence on goods and services inflation. From a policy making perspective, the key take-away is that for inflation to fall further, it will require an easing of both supply and demand pressures, with the latter increasingly important for services in recent months.
The inflation rate in each month is the increase in the price level compared with the same month in the previous year. As a result, unusual factors in the base period (i.e. one year ago) affect the inflation rate in the current year. See Box E in QB1 2023 for a full explanation of base effects.