The views and opinions expressed in this paper are strictly those of the authors and do not necessarily reflect the views of the Austrian Institute of Economic Research, the Austrian National Bank or the ESCB. The authors take responsibility for any errors.
Closely following the seminal contribution of Jappelli and Pistaferri (2014) – based on Italian household survey data – we employ data of 22 European countries to assess the role of heterogeneity of the marginal propensity to consume (MPC) for fiscal policy in the Euro area. We document an average MPC of 0.46 in the Euro area and illustrate its heterogeneity across countries, household-characteristics, and major items of the households’ balance sheets such as cash-on-hand, liquid, and illiquid wealth. Households with low cash-on-hand have on average higher MPCs. Policy experiments show how the empirically measured heterogeneity in MPCs affects fiscal policy and makes it more effective in stimulating growth than under the assumption of uniform MPCs. We also highlight the role of MPC heterogeneity for monetary policy and deliver parameters for calibrating Heterogenous Agent New Keynesian models.
The marginal propensity to consume (MPC) is an essential object in modern day macroeconomics both in traditional IS-LM-AS-AD framework, as well as in state-of-the-art heterogeneous agents New Keynesian DSGE models. The MPC of households – the change in their consumption after a surprising, temporary income change, is central in determining the aggregate consumption response to different economic policies and macroeconomic shocks. New and detailed data have led to increased exploration of household MPCs, how they vary along household characteristics and the repercussions of this variation for economic policy.
We employ the third wave of the ECB Household Finance and Consumption Survey (HFCS) to describe the distribution of MPCs of households in the Euro area. We do so by using a unique direct survey question introduced in the third wave of the HFCS on how the household would hypothetically respond to a transitory income increase. Using self-reported answers of respondents regarding consumption responses, is one of three leading approaches to estimate MPCs. The other two revolve around using actual quasi-experiments to identify how different groups reacts after being different income changes and around using purely statistical methods to estimate the MPC. Our approach has the main advantages that it does not require imposing any structural assumptions on the relationships between income and consumption, nor does it require evidence from a historical policy experiment.
While there have been important contributions to analyse the distribution of households MPCs at the country level (Drescher et al. 2020), this is the first paper to combine Euro area data and explore the implications of household MPC differences for fiscal policy.
In the sample of 22 countries we analyse, the average MPC is 0.46. It varies between 0.33 in the Netherlands to 0.57 in Lithuania. We document the heterogeneity of MPCs between 0 and 1 across the distribution of income and assets, similar to previous studies. Households with low amounts of liquid assets particularly have higher MPCs on average than richer households.
We illustrate how the heterogeneity of MPCs matter by exploring several counterfactual simulations to assess the quantitative repercussions of households having unequal MPCs in comparison to all households having the same MPCs as in classical representative agent. The effects of fiscal policy are closely dependent on the consumption responses of households. In the traditional representative agent models these effects cancel each other, because both groups have a uniform MPC – and therefore the consumption responses of rich households are only a scaled-up version of the responses of poorer households. With MPC heterogeneity this is not the case. In general, we find that with MPC heterogeneity the response of aggregate consumption is substantially higher than when the MPC across households is uniform, in line with previous finding by Jappelli and Pistaferri (2014).
The ECB Household Finance and Consumption Survey (HFCS) is a detailed microdata survey, where Euro area households respond to an extensive questionnaire regarding their household characteristics, income, consumption, assets, liabilities and other information. We use the third wave, mostly collected in 2017. A detailed overview of the first results of the third wave of the HFCS is presented in ECB (2020).
For our purposes, we focus on 22 countries1 and an underlying representative sample of overall 91.242 households.2 A household is defined as including all persons residing in the same dwelling who share household expenses and jointly take expenditure decisions. The HFCS collects data through personal interviews with the household head or the person most knowledgeable about the family’s finances. The third wave of the HFCS includes a unique question to assess consumption behaviour after transitory income shocks. The question asks:
”Imagine you unexpectedly receive money from a lottery, equal to the amount of income your household receives in a month. What percent would you spend over the next 12 months on goods and services, as opposed to any amount you would save for later or use to repay loans?”
Thus the HFCS data provides us with a precise quantitative MPC value for each household, making it possible to analyse the specific household characteristic that determine heterogenous MPCs. In contrast, many of the existing studies, which estimate MPCs, do that as average MPCs for specific groups e.g. per age, per income quintile or per household assets.
Figure 1 plots the empirical distribution of the MPCs of households for our sample of countries for the Euro area.3 The MPC mean across the sample is 0.46. This is in line with the theoretical literature and models that use liquidity constraints, myopia or differences in household patience and discount factors to enable high values of the MPC, in contrast to standard consumption models. There is also slight variation throughout countries – the lowest average MPC is found in the Netherlands with 0.33, while the highest is in Lithuania with 0.57.
The answers are clustered around three points – 0, 0.5 and 1. The first group of households, with an MPC of 0, can be called Ricardian households and act as permanent-income consumers – they save the extra income and spend only the annuity of it. The second group seems to use a rule-of-thumb in how they respond by stating they will spend half of the extra income and save the rest. The third group is the group of liquidity-constrained households with an MPC of 1. These households consume all the extra income and are hand-to-mouth. Furthermore, we see the pattern of “heaping” – almost all the answers of respondents are around round numbers.
Next, we report the MPC across different percentiles of the household distribution regarding its asset holdings. Figure 2 reports the average MPC of different households regarding their cash holdings defined as the sum of their gross income and their financial assets. In line with the theoretical considerations regarding these three dimensions, a negative relationship can be observed for all three – the average MPC of household decreases with higher cash-on-hand holdings, with higher income and with higher holdings of financial assets. While for the lowest percentiles in terms of cash holdings average MPC equals around 59%, it declines to around 42% for the households with the highest cash-on-hand. The decline in the polynomial function is the steepest when observing household MPC regarding their cash-on-hand holdings – pointing to the fact that liquid wealth is the most direct factor explaining differences in MPCs.
Figure 1: Self-Reported MPC from Transitory Income Shock, Euro area, Third Wave of the HFCS
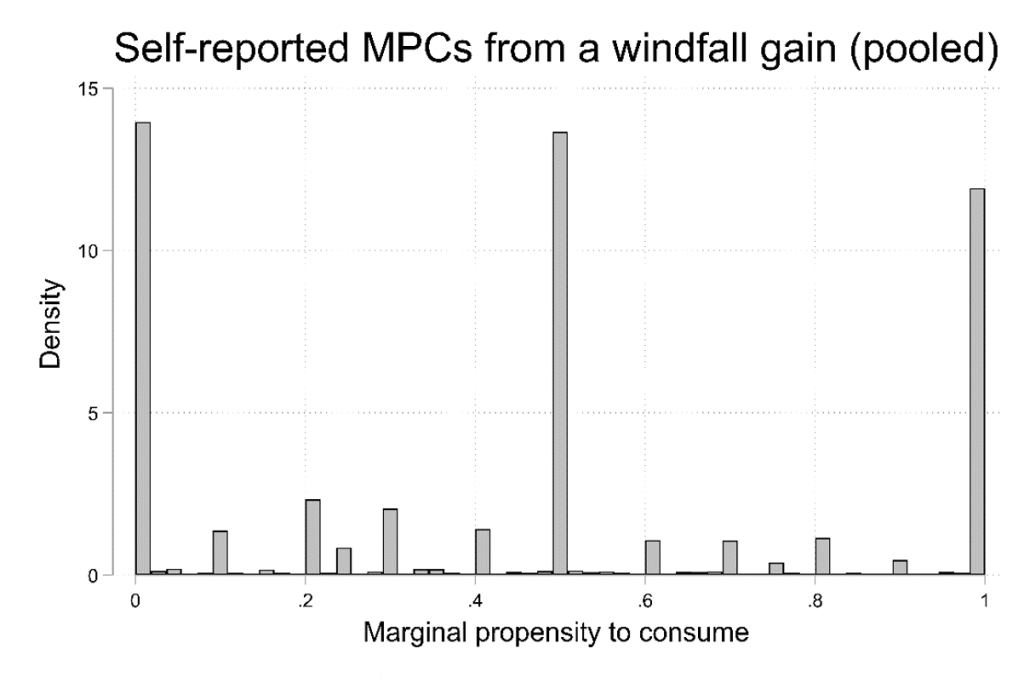
Figure 2. Average MPC by Cash-on-Hand Percentiles, Euro area, Third Wave of the HFCS

Across our sample, the mean reported MPC is 0.46, while the median reported MPC is 0.50. The mean and median age of the household head is 54 years. Mean cash holdings of the household are about 92,000 Euro, while the median cash holdings are much lower at around 47,000 Euro. The mean income of the households in the sample stands at around 42,000 Euro, while the median income at 31,000 Euro. The mean total financial assets (excluding public and occupational pensions plans) are around 51,000 Euro, while the median total financial as-sets are only at about 10,000 Euro. From the respondents, around 62% are male and 38% are female.
Using this sample of data, we then analyse the factors that explain differences in MPCs of households by using a regression analysis with a Tobit model. For our main specification, the correlation between MPCs and the dummy of being part of the lowest cash on hand quintile is statistically significant – households with the lowest cash on hand holdings tend to have 9 percentage points higher MPCs than the household in the highest quintile of cash-on-hand. MPCs correlate also significantly with being married and with the education category. Furthermore, household size signal that the reported MPC tends to be lower for larger households. These relations hold also on the level of most individual countries.
How does the heterogeneity of consumption responses to surprising income changes affect our standard evalua-tion of fiscal policy? To assess that, we run an experiment which consists of giving a transfer of 1% of the aggre-gate annual gross household income to the lowest 10% of households in the form of a lump-sum transfer. This transfer is financed by issuing debt, therefore without new taxes. We calculate how much would aggregate con-sumption increase after this increase in income, given two different distributions of MPCs – one that is homoge-neous and where the MPC of each household is given by the mean MPC, and another whether we take the MPCs actually reported in the HFCS sample. In the first case, the aggregate MPC obviously is equal to the mean MPC of 0.46. This leads to an increase in consumption by 1.25%. When we instead use the heterogeneous MPCs obtained by using self-reported MPCs from the HFCS, the aggregate MPC is higher, as the lower income households have higher than average MPCs. Thus, it leads to an increase in consumption by 1.29%. To compare this result, let us imagine the transfer is instead a lump-sum transfer to the highest income decile. The average MPC is then instead only 0.43 and leads to a consumption response of 1.16%. Comparing the two results, the consumption response is therefore 11% higher when the fiscal stimulus is targeted to the lowest income deciles instead of the highest in-come deciles.
We furthermore explore an additional experiment, where the same fiscal transfer is given one of two groups – to the members of households working in a contact intensive sector or to those that work in a less contact-intensive sector, a question which was relevant during the COVID19 pandemic and the ensuing stimulus programmes. Us-ing the HFCS sample from Austria, these is a significant difference between the mean MPC in the two sectors – 0.40 in the Financial Services sector versus a much higher mean MPC of 0.59 in the Arts sector. This results in a significantly more efficient fiscal stimulus. The multiplier increases from 1.17% to 1.70% if the fiscal transfer is correctly targeted to the high MPC sector of the economy. This shows the important implications of optimal tar-geting of government measures in future crises.
In this paper we document MPCs of households in the Euro area given the HFCS Third Wave. We find that in the countries in our sample, the mean reported MPC is 0.46 and the median reported MPC is 0.50. It also varies throughout countries – the lowest average MPC is found in the Netherlands – 33% while the highest is in Lithua-nia –57%. In line with theory, it also varies with household income and assets. A negative relationship can be ob-served for all three main dimensions – the average MPC of household decreases with higher cash-on-hand hold-ings, with higher income and with higher holdings of financial assets. While for the lowest percentiles in terms of cash holdings average MPC equals around 59%, it declines to around 42% for households with the highest cash-on-hand.
We analyse the factors behind the heterogeneity of these intended MPCs. There is a clear and strong relationship between MPCs and financial resources of households. Both along the income distribution and along the wealth distribution, poorer households have on average considerably higher MPCs, as expected from theory. This is most clearly the case when looking at holdings of liquid wealth. MPCs (positively) correlate significantly with being married and with the education category. However, they are found to be roughly constant throughout the working life, suggesting the importance of health risks and bequest motives in shaping consumption decisions.
Finally, we analyse how fiscal policy is affected by the fact that households have different MPCs. We explore how is the effectiveness of fiscal policy – in terms of the aggregate MPC and the aggregate consumption responses – affected from a specific policy in the case of MPC homogeneity and in the case of MPC heterogeneity such as the one observed in our data. We find that a debt-financed increase in transfers of 1 percent of aggregate gross household income in the euro area targeted to the bottom decile of income distribution would increase aggregate consumption by 1.29 percent (11 percentage points more than when targeted to the top decile of the income distribution).
Jappelli, Tullio, and Luigi Pistaferri (2014): Fiscal Policy and MPC Heterogeneity, American Economic Journal: Macroeconomics, 6(4), 10736.
Drescher, K., Fessler, P. and Lindner, P. (2020). Helicopter Money in Europe: New Evidence on the Marginal Propensity to Consume across European Households. Economics Letters.
European Central Bank (2020), The Household Finance and Consumption Survey: results from the third wave, Statistical Paper Series, March 2020, European Central Bank.
The countries in question are all euro area countries: Austria, Belgium, Cyprus, Germany, Estonia, Finland, France, Greece, Ireland, Italy, Lithuania, Luxembourg, Latvia, Malta, Netherlands, Portugal, Slovenia, Slovakia, Spain; and additionally: Croatia, Hungary, and Poland.
Representing about 170 million European households when weighted.
A few countries are missing in this sample. Data is missing on the specific MPC question for Estonia and Finland, so these countries are dropped from the sample. Even so, our sample of countries includes 98% of the Euro area GDP. Furthermore, 2.4% of households are missing on the MPC question in some remaining countries due to item-nonresponse, so these households are also dropped from the sample. The resulting sample size is N=63.593. Only 1.2% of these observations have imputed values in the MPC question.