We identify jointly supply chain disruption shocks and energy supply shocks together with demand shocks using a structural Bayesian vector autoregression model with narrative restrictions. The impact of adverse supply chain disruption shocks on inflation expectations and core consumer prices is relatively strong and rather persistent, while the impact is small and transitory after energy supply shocks. The response of real GDP is reversed: strong and shorter after a supply chain disruption shock, but milder and more long lasting after an energy supply shock. Supply chain disruption shocks and favourable demand shocks explain the large fraction of fluctuations in real GDP between 2020 and 2022. The dynamics of core prices and inflation expectations are instead mostly explained by supply chain disruption shocks and to a lesser extent by adverse energy supply shocks.
After a prolonged period of low inflation rates, since the second half of 2021, the euro area recorded extraordinarily large increases in headline and core consumer prices. Two supply forces associated to disruptions in global supply-chains and energy shortages played a key role in the dynamics of output and prices during the 2020-2022 period. With the reopening of the economic after the restrictions due to the pandemic, also demand forces contributed to the dynamics of the business cycle.
With the collapse of world trade in April 2020, cargo ships were not able to run at full capacity and many containers were left to pile up in western countries’ ports due to the lockdowns. After the summer of 2020, once global demand had picked up again, the lack of containers to transport these goods from Asia to the United States and Europe owing to the misplacement of the containers globally, as well as numerous vessels arriving at their destinations well outside of schedule (exacerbated by the massive container ship that blocked the Suez Canal), led to considerable supply bottlenecks.
The adverse energy supply shocks originated from the cut of the gas supply from Russia to the European Union in the summer 2021, which contributed to the slow replenishment of gas inventories in Europe ahead of the winter season and, as a result, energy prices rose.
We investigate the transmission mechanism of supply chain disruption shocks and energy supply shocks on output and prices using a Bayesian SVAR with narrative restrictions, leaving unrestricted the impact on GDP, core prices, and expected inflation.1 To identify the supply-chains disruption shocks, we use the automotive suppliers’ delivery times, which captures the extent of supply chain delays in the motor vehicle sector, together with vehicle production and prices, and the extreme volatility recorded in the suppliers’ delivery times when the pandemic hit. As for the identification of the energy supply shocks, we employ retail energy prices together with the output of the energy-intensive sector and the extreme volatility in retail energy prices recorded with the gas shortages in the Autumn 2021 and the begin of the war in Ukraine.
We show that the impact of adverse supply chain disruption shocks on core HICP (Harmonized Index of Consumer Prices) is strong and rather persistent, while the impact on inflation expectations is small yet positive (see Figure 1). Conversely, the impact of energy supply shocks is minor and transitory on both expected inflation and core prices. GDP instead drops immediately after a supply chain disruption shock and in the medium term after a retail energy supply shock.
Figure 1: Output and price response to supply chain disruption shocks and energy supply shocks
(percent, x-axis: months)
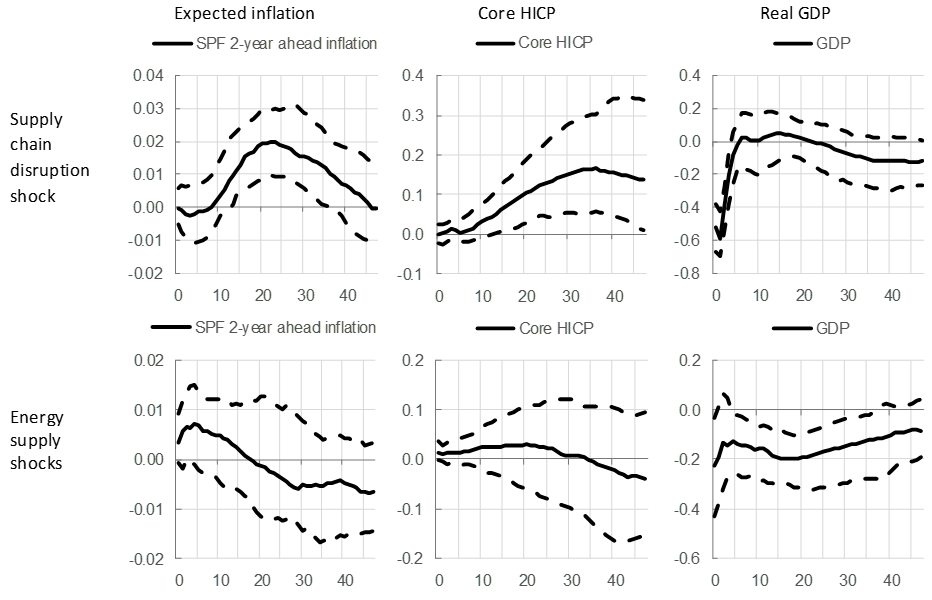
Notes: The chart reports the impulse response function and the 84% credible sets of key variables. The response is based on the Bayesian VAR model from De Santis (2024).
Both adverse supply-chain disruption shocks and retail energy supply shocks can explain a large faction of output and price fluctuations in the 2020-2022 period. Between January 2020 and September 2022, the supply shocks account for two thirds of the 8% increase (excl. trend) in HICP, about 55% of the 2.7% increase (excl. trend) in core HICP and about 60% of the 0.6 percentage point increase (excl. trend) in 2-year ahead inflation expectations (see Figure 2). Since the partial reopening of the economy in the summer of 2021, 10% of the 3.4% increase in core HICP and 20% of the 0.6% increase in 2-year ahead inflation expectations are attributed to demand shocks.
As for the real side, supply bottlenecks have prevented euro area firms from increasing their production in line with the rapid recovery in demand for manufacturing goods in 2021 and 2022 (see third panel of Figure 2). Supply-chain disruption shocks played a key role when the pandemic hit, explaining about 35% of the drop in GDP in March-April 2020. The re-organization of the supply chains was rather fast in the summer 2020, but such shocks hit activity again in the autumn 2020. Since the beginning of 2020 and by September 2022, real GDP would have been 1.9% higher in absence of supply chain disruption shocks. The contribution of demand forces was particularity strong after the first round of vaccination from Covid in the spring 2021. The situation has been volatile since October 2021 because adverse energy supply shocks started to cause a reduction in output, as the energy crunch intensified in the euro area culminating in the war of Russia against Ukraine. However, energy supply shocks have only marginally affected real GDP also because fiscal policy were employed to limit the rise in energy prices. Also demand shocks contributed to the dynamics of real GDP. They explain about 25% of the drop in GDP in March-April 2020. The demand recovery was fast and steady. The contribution of demand forces was particularity strong after the first round of vaccination from Covid in the spring 2021. Since the beginning of 2020 and by September 2022, real GDP would have been 2.4% lower in absence of the favourable demand shocks.
Finally, the evolution of suppliers’ delivery times (see fourth panel of Figure 2) indicates that both supply chain disruption shocks and demand forces played a key role. It is worth pointing out that the drop in aggregate demand when the pandemic hit in March 2020 shortened the time to delivery intermediated inputs, while the pickup in demand since the last quarter of 2020 contributed to its lengthening.
Figure 2: Historical Decomposition of Shocks since the Pandemic Period
(percent, percentage points, deviation from stochastic trend)
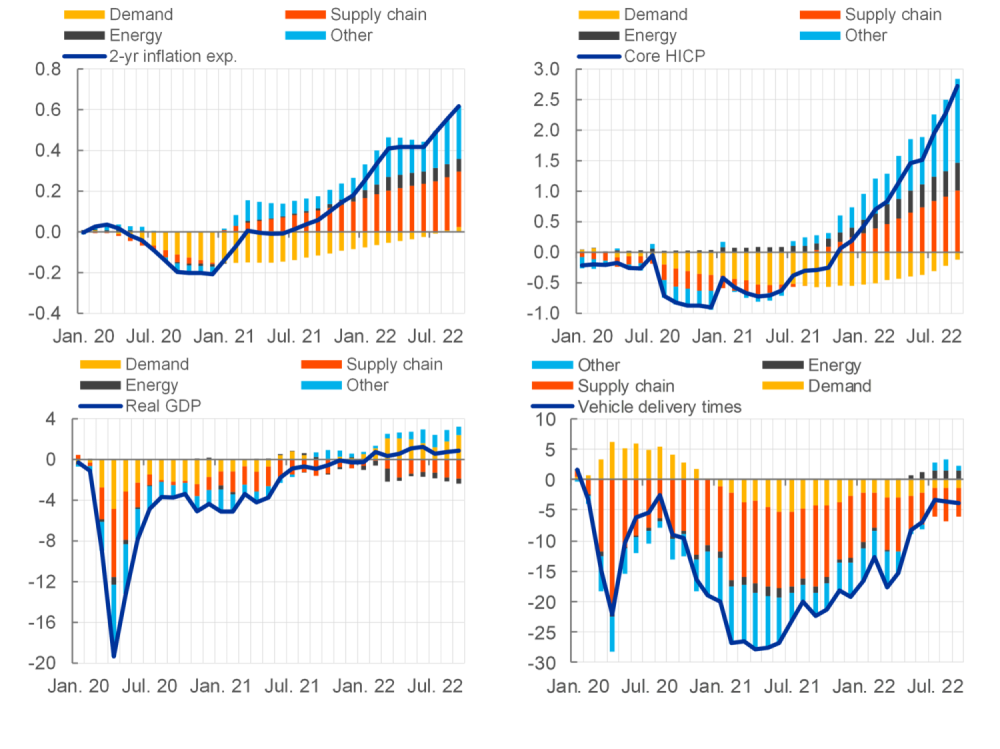
Notes: The chart reports the historical decomposition of key variables. The decomposition is based on the Bayesian VAR model from De Santis (2024).
Recent data suggest that supply bottlenecks in the euro area have improved substantially, and energy inflation has declined. After the 40% increase in energy prices in annual terms recorded in 2022, energy inflation was negative in the course of 2023. Therefore, adverse energy shocks have been fading away. The PMI suppliers’ delivery times of the motor vehicle sector, which is useful for monitoring supply disruptions in the transportation and logistics sector, has improved substantially in 2023 with the index rising will above the 50-threshold. This points to a substantial shortening of the time required to deliver intermediated inputs. The softening of euro area demand might have contributed to these developments. The more recent red sea disruptions, which began in October 2023, do not seem to have affected much the supply chains; these pressures are so far limited.
Figure 3: PMI suppliers’ delivery times and energy price developments
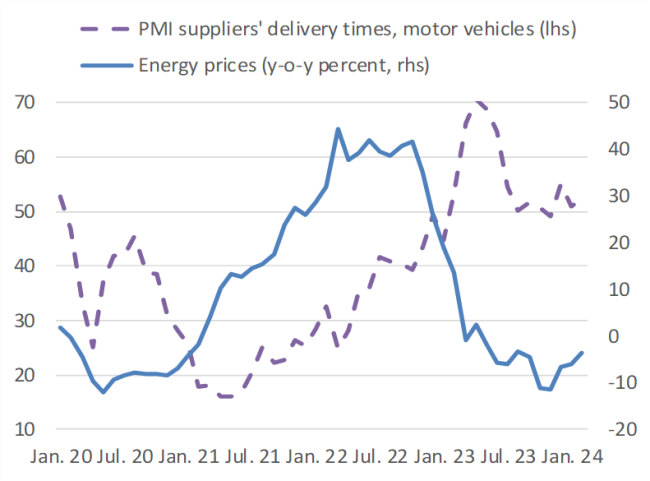
Sources: Eurostat, S&P Global.
Adolfsen, J.F., Ferrari Minesso, M., Mork, J.E., and Van Robays, I. (2024), “Gas price shocks and euro area inflation”. ECB Working Paper Series, 2905.
Ascari, G, D Bonam and A Smadu (2024), “Global supply chain pressures, inflation, and implications for monetary policy”, Journal of International Money and Finance 142.
Banbura, M., Bobeica, E. and Martínez Hernández, C. (2023), “What drives core inflation? The role of supply shocks”, ECB Working Paper Series, No 2875.
Carrière-Swallow, Y., Deb, P., Furceri, D., Jiménez, D., and Ostry, J. D. (2023), “Shipping costs and inflation”, Journal of International Money and Finance, Vol.130, p.102771.
Casoli, C., Manera, M. and Valenti, D. (2022), “Energy shocks in the Euro area: disentangling the pass-through from oil and gas prices to inflation”, Fondazione ENI Enrico Mattei Working Paper, n. 45.
De Santis, R.A. and Tornese, T. (2023) “Retail Energy Price Shocks’ Nonlinearities on Output and Prices”, ECB Working Paper Series, n. 2834 and VoxEU.
De Santis, R. A. (2024) “Supply Chain Disruption and Energy Supply Shocks: Impact on Euro Area Output and Prices, International Journal of Central Banking, forthcoming and ECB Working Paper Series, n. 2884.
Finck D., Klein M. and Tillmann P. (2023), The Inflationary Effects of Global Supply Chain Shocks: Evidence from Swedish Microdata, University of Giessen.
Finck D. and Tillmann P. (2023), The Macroeconomic Effects of Global Supply Chain Disruptions, University of Giessen
Neri, S. (2024), The transmission of energy price shocks in the euro area, Banca d’Italia, mimeo.
Tillmann, P. (2024), The asymmetric effect of supply chain pressure on inflation, Economic Letters, Volume 235, 111540.
Recent literature has studied the impact of supply chain disruption shocks and adverse gas price shocks (Ascari et al., 2024; Adolfsen et al., 2024; Neri, 2024; Tillmann, 2024; Bańbura et al, 2023; Carrière-Swallow et al., 2023; Finck D. and Tillmann P., 2023; Finck, et al., 2023; Casoli et al., 2022). De Santis and Tornese (2024) have investigated the non-linear transmission mechanism of energy supply shocks. They find that non-linearities may amplify the inflation response in the high inflation regime.