menu
close

Author(s):

Isabel Schnabel | European Central Bank (ECB)

Keywords:

Fiscal dominance , monetary dominance , fiscal-monetary policy interactions , public debt sustainability , market discipline , financial repression , unconventional monetary policy interaction , COVID-19 crisis , natural rate of interest

JEL Codes:

E42 , E52 , E58 , E61 , H63 , P48

The euro has been built on the principle of monetary dominance.

This means that the European Central Bank (ECB) pursues its monetary policy objectives, as defined by its mandate in the European Treaties, without being constrained by other considerations. This principle was buttressed by granting the ECB statutory independence. The ECB is said to be one of the world’s most independent central banks.

At the time of the Maastricht Treaty, high government debt was seen as a major threat to central bank independence, and it was feared that fiscal dominance could induce a central bank to deviate from its monetary policy objectives, endangering price stability.

This was not just idle speculation. History is full of examples of high government debt eventually being resolved through higher inflation and financial repression.2

The Stability and Growth Pact was designed to ensure that governments would pursue sound fiscal policies and that public debt would remain low and stable, or at least converge to such levels in a gradual and credible manner. The fiscal framework of the European Union was meant to shield the ECB from fiscal dominance and protect its independence.

In the eyes of some observers, the legacy of the 2008 global financial crisis, together with the far-reaching repercussions of the coronavirus (COVID-19) pandemic, is now threatening to undermine the consensus model of monetary dominance, not just in the euro area, but globally.

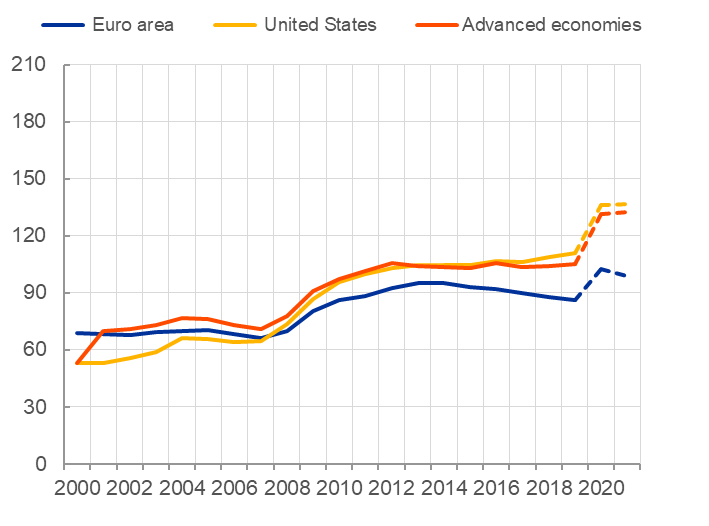
According to the International Monetary Fund (IMF), general government gross debt in advanced economies increased from 71% of GDP in 2007 to 105% last year, and is projected to rise to 132% by the end of next year (see left chart Figure 1). In the euro area, it increased from around 66% in 2007 to 84% last year and, provided the crisis does not deepen much further, will likely stabilise at around 100% next year, well below the average level of advanced economies.

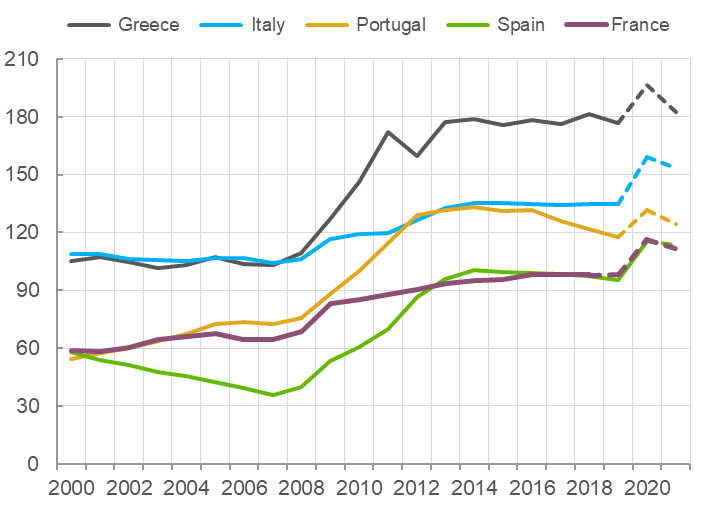
But aggregate figures often mask large underlying heterogeneity. In some euro area countries, public debt will increase to levels well above 100% (see right chart Figure 1).

Figure 1. General government gross debt (% of GDP)

 width=  width=
Sources: European Commission Economic Forecast Spring 2020 and IMF. Dashed lines are projections. Source: European Commission Economic Forecast Spring 2020. Dashed lines are projections.

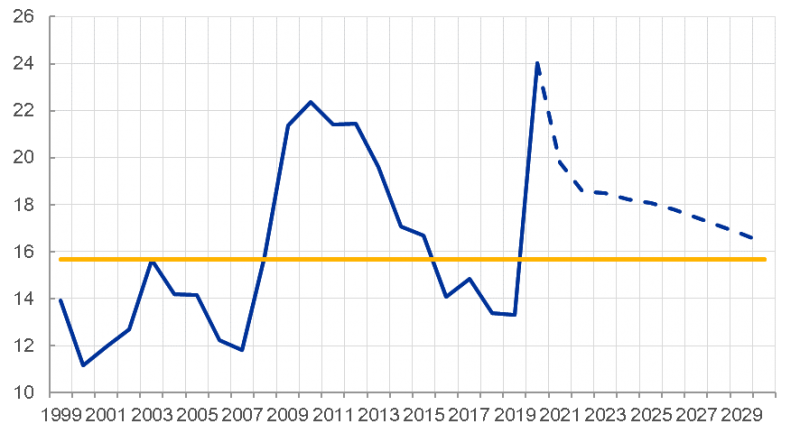
Rising indebtedness implies that governments will need to roll over increasing amounts of debt, on top of the need to finance newly issued debt. ECB staff estimate that the gross financing needs of euro area countries will likely reach 24% of GDP this year alone and remain elevated for a considerable period of time, likely for longer than in the aftermath of the global financial crisis (see Figure 2).


Figure 2
. Euro area sovereign gross financing needs (% of GDP)
 width=
Source: ECB staff calculations.
Note: Gross financing needs are calculated as the sum of redemptions and the change in government debt. Future deficits are assumed to broadly comply with the Stability and Growth Pact. The dashed lines are projections. The yellow line indicates the average between 1999 and 2019.

Concerns about the state of public finances have been reinforced by structural headwinds related to the worsening demographic outlook in many advanced economies and to the material public investment needs associated with financing the transition towards an economy that is environmentally sustainable.3

The newly launched European recovery fund has helped alleviate some concerns about the impact of the pandemic on sovereign debt levels in the countries hit hardest by the crisis, which tend to be those with the highest public debt levels.

Yet, the euro area is still far from being a fiscal union. And even if it were, there would still be the question, as in other advanced economies, of whether rising debt has jeopardised, or will jeopardise, monetary dominance and, as a result, central bank independence.

Indeed, some observers have taken the launch of the asset purchase programme (APP) and, more recently, the pandemic emergency purchase programme (PEPP) as a sign that the ECB has started monetising sovereign debt at the expense of its primary mandate of price stability.

They accuse the ECB of undermining fiscal discipline by keeping interest rates artificially low and of assuming powers that the European Treaties reserve for national governments.

Deviations from the capital key under the PEPP are interpreted as tailoring monetary policy towards the most highly indebted euro area countries, in order to ease their debt burden and avoid destabilising the currency union as a whole.

These claims are not new. Central bank independence was already coming under close scrutiny before the pandemic, not only in the euro area.4

I would like to structure my remarks in three parts.

The first part deals with the misconception that the ECB’s policies constitute a form of “financial repression”.

The second part discusses the disciplinary function of sovereign bond markets and provides evidence that it has not been lost in the wake of the ECB’s unconventional policies. I will also argue that market failures imply a role for central banks in stabilising government bond market in times of stress.

The third and final part opens up perspectives on the changed interactions between fiscal and monetary policy in a low-interest-rate environment and what it implies for the longer term.

ECB policies do not constitute “financial repression”

The term “financial repression” typically refers to policy measures that aim at keeping interest rates artificially low, making it easier for governments to finance their debt.

Financial repression can take many different forms, such as restrictions on capital movements or direct interest rate controls. More recently, however, the term is increasingly being used with respect to central bank policies, including asset purchases and negative interest rates.5

History teaches us that financial repression typically crowds out private investment and thereby leads to lower growth and employment.6

But research shows that the opposite has been true for the euro area since the start of the public sector purchase programme (PSPP) in 2015. ECB staff estimate that, in the absence of our sovereign bond purchases, as of the end of last year, real GDP growth would have been around 1.4 percentage points lower.

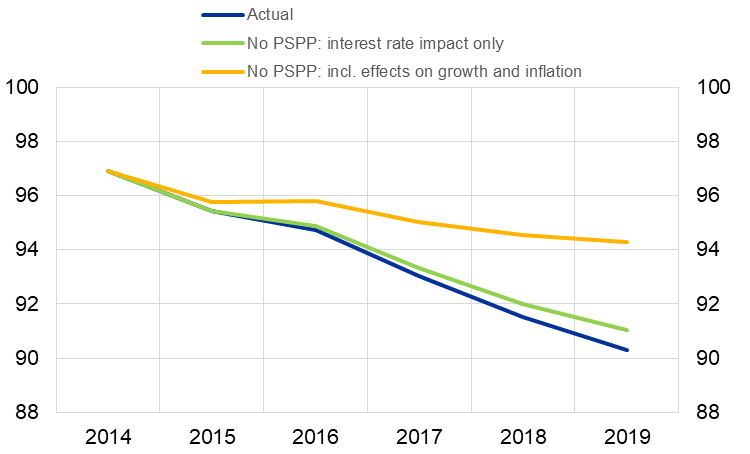
In other words, without the positive effects of our measures on growth and inflation, the public debt ratio in the euro area would have been notably higher. By contrast, the impact through lower interest rate expenses – which is often at the centre of debate – has, on aggregate, been comparatively small. These effects are clearly visible when looking at the counterfactual paths of government debt in the euro area (see Figure 3).

Monetary policy is not guided by the wish to lower the public debt burden but by its mandate of price stability. There is, in fact, no evidence of a feedback loop from sovereign debt developments to monetary policy decisions.

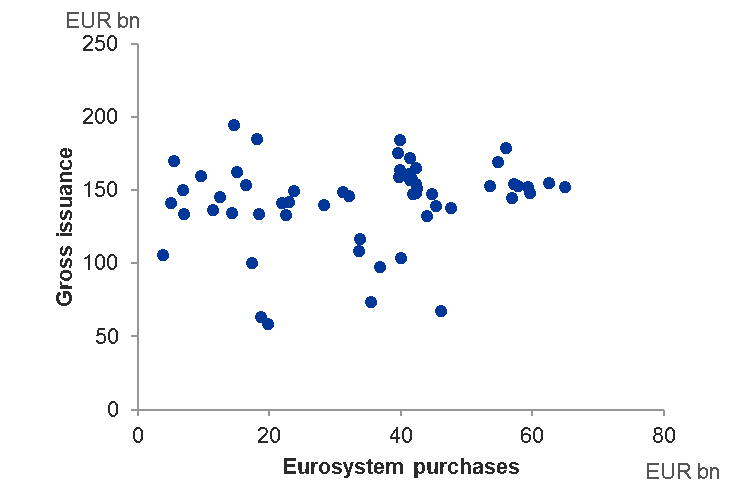
First, there is no systematic relationship between government bond issuance and the amount of bonds that we purchase in the secondary market (see Figure 4).7 Rather, our measures aim to deliver financial conditions that are consistent with a return of inflation to our medium-term aim.

Figure 3. Government debt: actual and counterfactuals (% of GDP) Figure 4. Debt securities issued by euro area central governments and Eurosystem purchases, 2015-2019
 width=  width=
Source: ECB staff calculations.
Note: The counterfactual exercise of no-PSPP is based on internal estimates of the impact of the PSPP on the main sovereign financing rate (green line) and its impact on real GDP growth and inflation (yellow line).
Source: ECB.
Note: Monthly data between March 2015 and December 2019. Eurosystem purchases refer to central government debt securities under the PSPP. Gross issuance covers euro-denominated debt securities by central governments in the euro area.

Sovereign bond issuance is one factor that affects these conditions.8 But there are many other factors, such as the nominal growth outlook or sudden swings in investor risk appetite, that may cause a shift in financial conditions, thereby posing a threat to price stability and inducing monetary policy action.

Second, our monetary policy stance is not directly related to the level of sovereign debt. One, albeit blunt, way to gauge the appropriateness of the policy stance is to consider simple Taylor-type policy rules.

Although such rules neglect the significant uncertainty policymakers face when setting policy, their explicit lack of discretion can be used as a yardstick for assessing whether monetary policy systematically pursues a course of action that is inconsistent with price stability.9

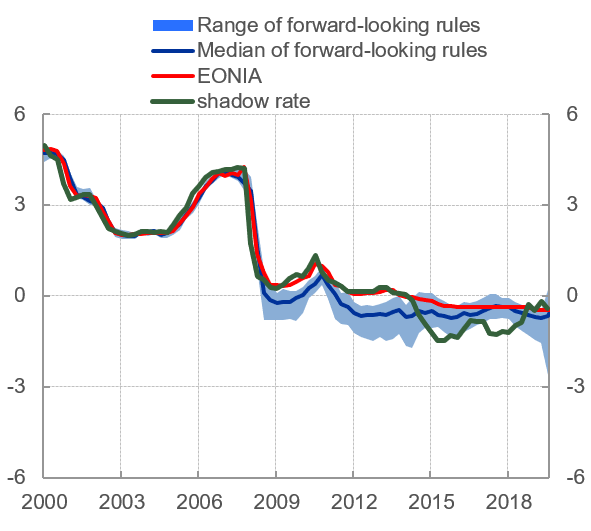
ECB research demonstrates that, since the global financial crisis, actual and shadow policy rates – a synthetic short-term rate indicator often used in the literature to also capture non-standard policy measures – have followed a path that is not far from the ECB’s reaction function with respect to output and prices, as estimated from Taylor rules over the period from 2000 to 2008 (see Figure 5).10

In other words, the surge in debt after the global financial crisis does not seem to have led to a structural break in the ECB’s reaction function, including during the current COVID-19 crisis.

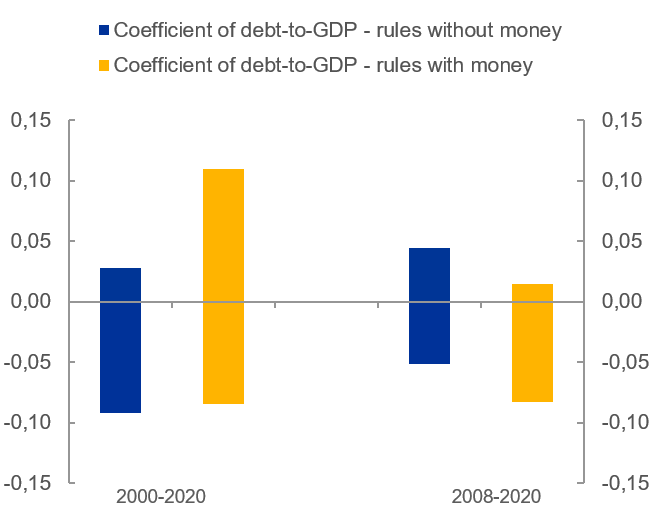
When adding government debt to policy rules as an additional explicit feedback variable, its coefficient is generally not statistically significantly different from zero (see Figure 6). This result remains true independent of the estimation sample or the precise specification of the rule.

Figure 5. Taylor-type policy rules (%)
 width=
Sources: European Commission, ECB and ECB computations.
Notes: The estimated policy rules are derived using a real-time framework which estimates a variety of plausible specifications, using initially six measures of expected economic activity, four indicators of inflation expectations, and two credit variables. The light blue range shows the resultant min/max range of all rules, which are estimated over the sample 2000Q3 to 2008Q2. The shadow rate represents an estimate for the short-term interest rate that would prevail in the absence of the lower bound, see Lemke and Vladu (2017), “Below the zero lower bound: a shadow-rate term structure model for the euro area”, ECB Working Paper No 1991.
Latest observation: 2020Q2, June BMPE.

Figure 6. Confidence intervals of policy rules with sovereign debt
 width=
Source: European Commission, ECB and ECB computations.
Notes: The confidence intervals were derived using the set of rules shown on the left-hand side with the additional inclusion of the debt-to-GDP ratio.

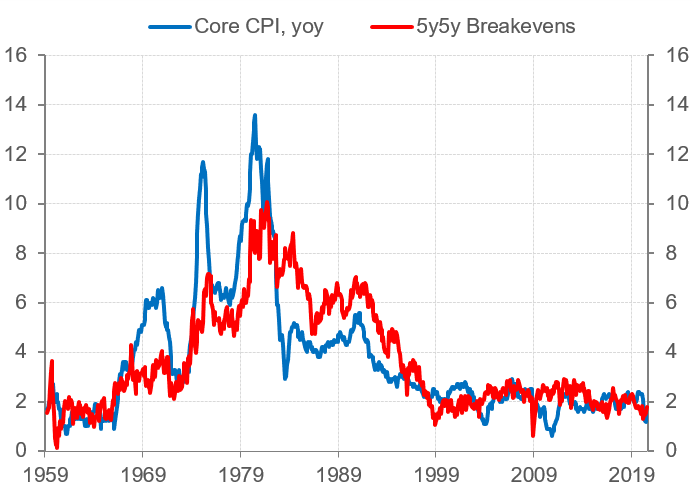
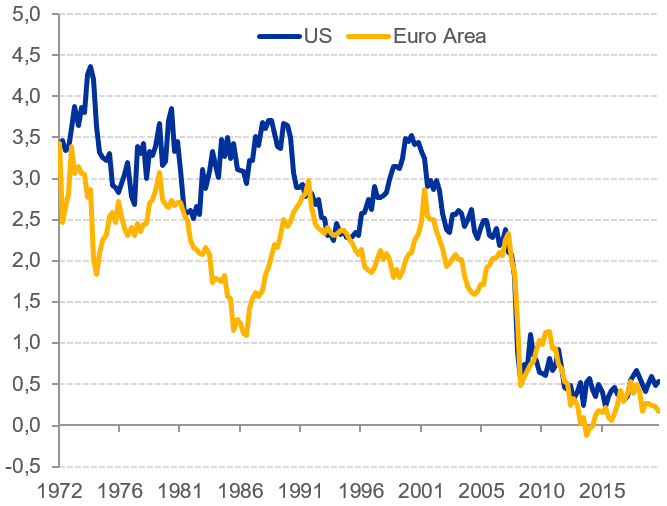
Finally, under fiscal dominance, where the central bank is constrained in its ability to secure price stability, one would expect medium- to long-term inflation expectations to rise sharply, as the public expects the central bank to monetise debt. This was the case in the 1970s – a time when political interference in the conduct of monetary policy was still widespread and central banks were lacking independence (see Figure 7).11

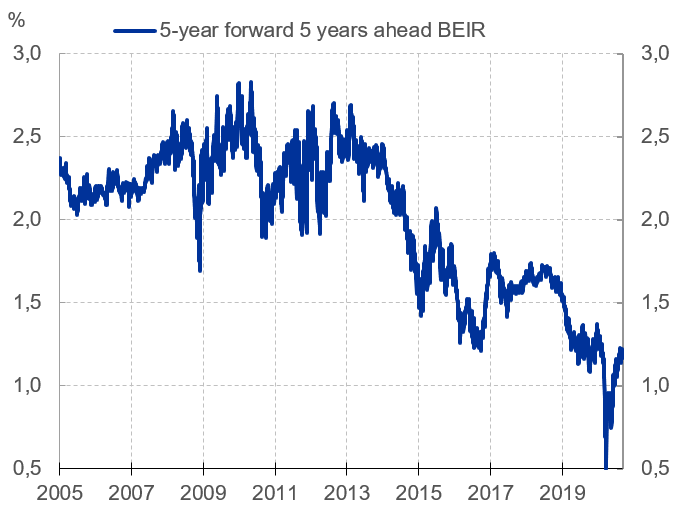
Today, however, financial markets and survey data do not suggest that people expect inflation to accelerate. Although inflation expectations have recovered from their record lows, they remain well below the levels that we would consider consistent with our medium-term aim of below, but close to, 2% (see Figure 8).

Too low rather than too high inflation remains the main predicament of our times.

Figure 7. US core CPI and 5y5y breakeven inflation rates (%)  Figure 8. Euro area 5y5y breakeven inflation rates (%)
  width=  width=
Source: Goldman Sachs.
Notes: Backcasting of inflation breakevens based on a methodology proposed by Groen, J. and M. Middeldorp (2013), “Creating a History  of U.S. Inflation Expectations”, Liberty Street Economics, 21 August.
Last observation: August 2020.
Source: Refinitiv, ECB calculations.
Notes: The BEIR is calculated by subtracting seasonally adjusted real rates of HICPxT inflation-linked bonds from same-maturity nominal bond yields of the same issuing country. Latest data: 8 September 2020.

The disciplinary function of markets has not been lost

Let me now turn to the question of whether sovereign bond markets are still performing their disciplinary role, in spite of the ECB’s asset purchases.

Although interest rates have fallen broadly across advanced economies in recent years, risk premia in euro area sovereign bond markets have not disappeared.

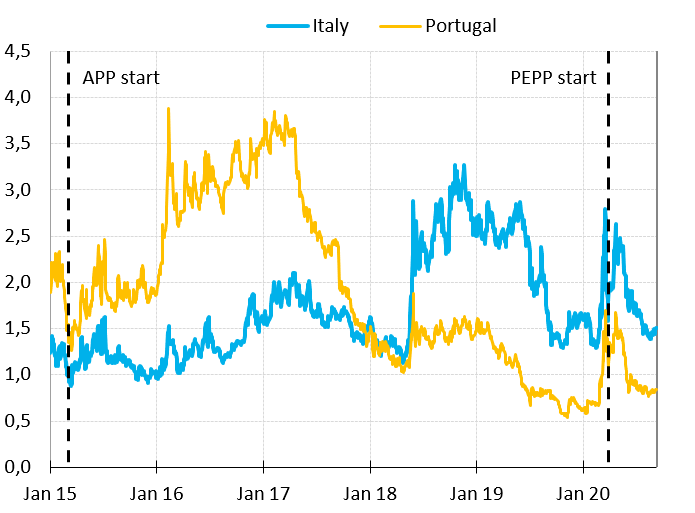
Today, for example, 10-year yield spreads on Italian government bonds over their German equivalents are higher than when the ECB started to purchase government bonds in early 2015 (see Figure 9).

They also remain responsive to idiosyncratic news. The marked response of Italian sovereign bond yields to the 2018 episode of political instability, which by the way was not countered by monetary policy, underlines the disciplinary role played by financial markets.

And when spreads have fallen, this often reflected improvements in fiscal fundamentals and relative growth performance.

Take Portugal as an example. Its sovereign bond spreads have dropped substantially since 2017 (see Figure 9).

This went along with substantial improvements in fundamentals. Portugal’s budget balance turned from a deficit of -4.4% of GDP in 2015 to a surplus of 0.2% in 2019.

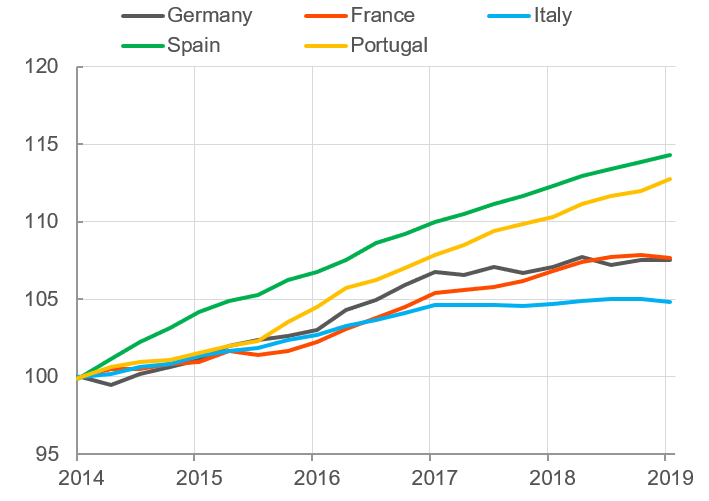
Portugal also outperformed most of its euro area peers in terms of growth: between 2014 and 2019, its economy expanded by almost 13%, compared with 7.5% in Germany (see Figure 10). Only in Spain, where spreads have also fallen, growth was even higher over the same period.

Figure 9. 10-year yield spreads of selected government bonds over German equivalents (%) Figure 10. Real GDP (index: 2014Q4 = 100)
 width=  width=
 Source: Bloomberg. Source: Eurostat.
Latest observation: 2019Q4.

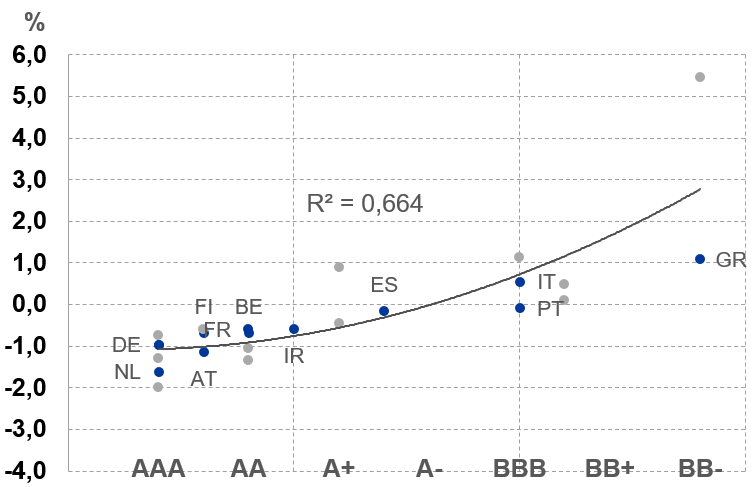
Euro area government bonds also consistently trade in line with their international peers when taking into account credit risk (see Figure 11). On average, the risk premia of euro area government bonds are relatively close to those of other advanced and major emerging market economies.12

Similarly, bond purchases by the ECB have not dampened the price discovery mechanism.

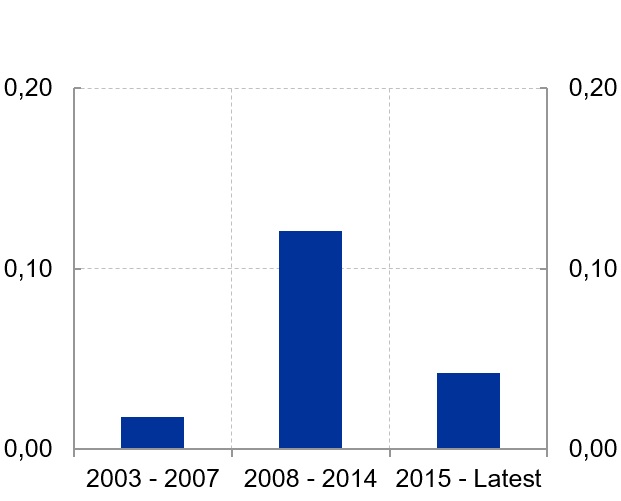
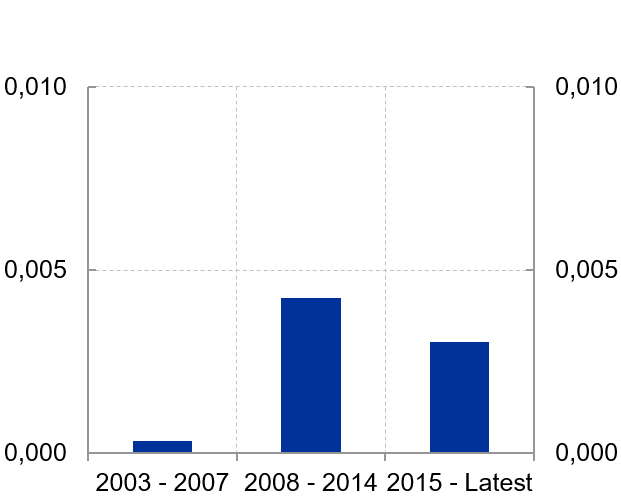
The sensitivities of euro area sovereign bond yields to macroeconomic surprises and changes in financial market risk remain far removed from the complacency that characterised financial markets in the run-up to the global financial crisis (see Figure 12).

Figure 11. Risk premia and credit ratings
 width=
Sources: Bloomberg, Refinitiv Datastream and ECB staff calculations.
Notes: The ratings are the foreign-currency long-term ratings from S&P. Term premia are estimated based on zero-coupon sovereign bond yields using the Dynamic Nelson-Siegel model. For the euro area, the expectation component is estimated from euro OIS data. Data points from non-euro area countries are marked in grey. The trendline represents the estimated term premium based on a second-order polynomial regression of the term premium on discretely scaled S&P ratings.
Latest observation: July 2020.

Figure 12.
Sensitivity of euro area sovereign spread to macroeconomic surprises (sum of regression coefficients)
 width=
Sources: Bloomberg, Refinitiv and ECB calculations.
Notes: Sensitivity is defined as the sum of absolute values of estimated coefficients, where coefficients result from univariate regressions, spanning the indicated time period, of daily changes in the 10-year EA GDP-weighted sovereign spread over the 10-year OIS on euro area macroeconomic surprises. Macroeconomic surprises are standardised deviations of Bloomberg median survey of analysts’ forecasts from actual release values

Sensitivity of euro area sovereign spread to financial market risk (regression coefficient)
 width=
Sources: Refinitiv and ECB calculations.
Notes: Sensitivity is defined as the regression coefficient from a regression of the daily changes of the 10-year euro area GDP-weighted sovereign spread over the 10-year OIS on daily changes in the VSTOXX. Latest observation: August 2020

At the same time, the overhaul of the euro area crisis management framework, including the establishment of the European Stability Mechanism (ESM) and the creation of the Single Supervisory Mechanism (SSM), has succeeded in reducing the excessively high sensitivity that prevailed during the crisis years.

Hence, markets remain vigilant even though central banks have taken a more prominent role in government bond markets.

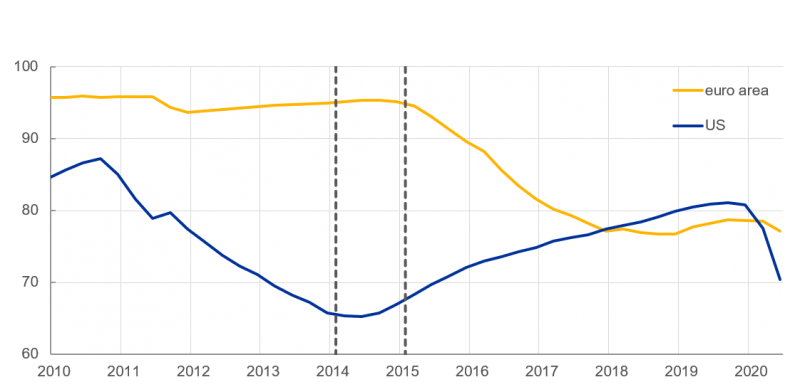
One important reason why financial markets are able to play a prominent role in the price discovery mechanism is that the net bond supply in the euro area is still ample.

The bond free float – that is, the share of bonds held by investors other than the Eurosystem – currently amounts to close to 80%, comparable to the level observed in the United States before the outbreak of the pandemic (see Figure 13). It has not declined significantly in the wake of the launch of the PEPP, as new issuances have injected fresh liquidity into the market.

Figure 13. Developments in the bond free float (percent)
 width=

Sources: SHS, ECB, ECB Calculations.
Notes: The free float measure is defined as the ten-year equivalent holdings of general government bonds by all investors other than the domestic central banks as a share of total supply. The bond free float for the euro area refers to the big-4 (Germany, France, Italy and Spain).
Last observation: Q2 2020.

But financial markets are neither always rational, nor efficient. They can be prone to panic and instability.13

Acute periods of market stress can drive a considerable wedge between a country’s cost of borrowing, as justified by economic fundamentals, and actual financial conditions, giving rise to self-fulling price spirals.

Such periods of turmoil – if left unaddressed – can quickly turn a liquidity crisis into a solvency crisis, giving rise to huge costs for society as a whole. Central banks are best placed to protect the public from such destabilising forces.

In the euro area, the ECB can only be a lender of last resort to financial institutions. The Treaty explicitly prohibits monetary financing of public debt.

But the ECB can, and should, provide liquidity when the market fails to coordinate and when the risk absorption capacity of financial market participants is severely constrained. Central bank interventions quickly instil confidence and allow the market to coordinate on the “good” equilibrium once the initial fog of panic and fear has lifted.

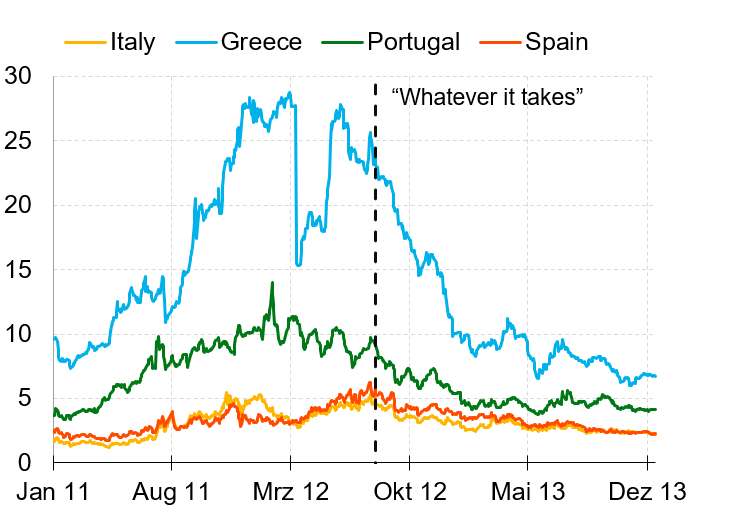
A prime example is the announcement of outright monetary transactions (OMT) in the summer of 2012. The “whatever it takes” speech by Mario Draghi constituted a coordination device and thereby calmed markets, whereby the euro area gained precious time for reforms (see left chart Figure 14).

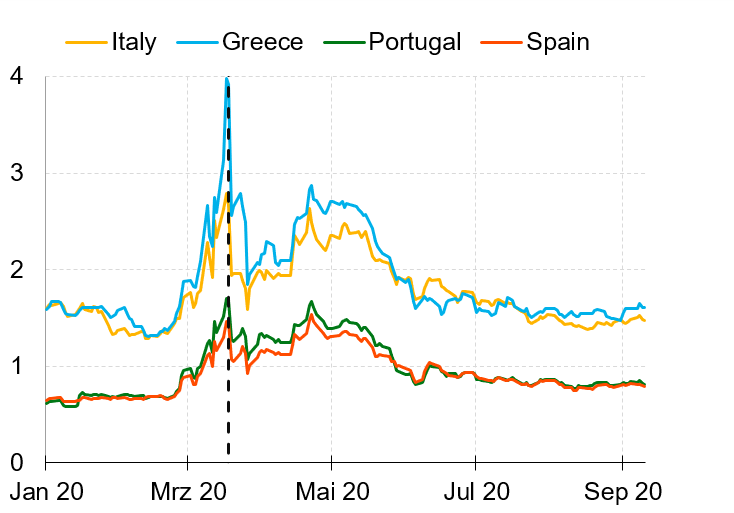
The announcement of the PEPP in March of this year operated similarly: it built a bridge for the historical response of euro area governments to this crisis and supported market functioning at a time of exceptional uncertainty (see right chart Figure 14).

In such situations, when yields are largely reflections of panic rather than fundamental factors, risks of moral hazard are negligible and should not prevent the central bank from acting forcefully.

Figure 14. 10-year yield spreads of selected government bonds over German equivalents (%)

OMT announcement PEPP announcement
 width=  width=
Source: Bloomberg. Source: Bloomberg.
Last observation: 10 September 2020

The changed interaction between fiscal and monetary policy

My final point relates to how the broader macroeconomic environment has led to a change in the way fiscal and monetary policy interact.

When the ECB was established in 1999, central banks had ample policy space and the experience from previous decades had demonstrated that the short-term interest rate was an effective instrument to steer inflation over the medium term.

Today, many central banks, including the ECB, find themselves in a very different environment. Slowly-moving structural factors, such as lower trend productivity growth, an ageing society and global excess savings, have led to a long-term decline of the real equilibrium interest rate. Therefore, conventional monetary policy has much less space to stabilise the economy when required (see Figure 15).

As a result, years of weak aggregate demand have forced central banks to introduce a wide range of non-standard monetary policy tools. Although these tools have proven quite effective in stimulating the economy, it is feared that their adverse side effects may increase the more intensively they are used and the longer they are maintained.

In short, the effective lower bound on interest rates has become a feature of our monetary policy.14

This has three important consequences.

The first consequence is that fiscal policy has become more important as a macroeconomic stabilisation tool. When natural rates are low and policy rates are constrained by the lower bound, a more accommodative fiscal policy is needed to lift the economy out of a low-growth, low-inflation trap.

The current pandemic crisis is a case in point. Fiscal expansion is indispensable at the current juncture to sustain demand and mitigate the long-term costs of the crisis. Monetary policy can complement these efforts. But by itself, it may not be sufficient to stabilise the economy. This is all the more true if different sectors, or regions, of the economy are affected in different ways.

In such times, it would be wrong to constrain fiscal policies today to protect monetary dominance tomorrow. Quite on the contrary, using fiscal and structural policies more actively in the current environment may foster central bank independence.

The reason is that such policies may boost potential growth and thereby increase monetary policy space in the future. Moreover, a countercyclical fiscal expansion may result in lower rather than higher government debt in the longer run.15

Calling on fiscal policy to play a more active role in macroeconomic stabilisation is not to be confused with modern monetary theory, which denies the government’s intertemporal budget constraint. Once the economy has recovered and is back on a sustainable growth path, fiscal policy should take a backseat again and regain policy space.

The second consequence is that fiscal policy has not only become more important, but also more effective.

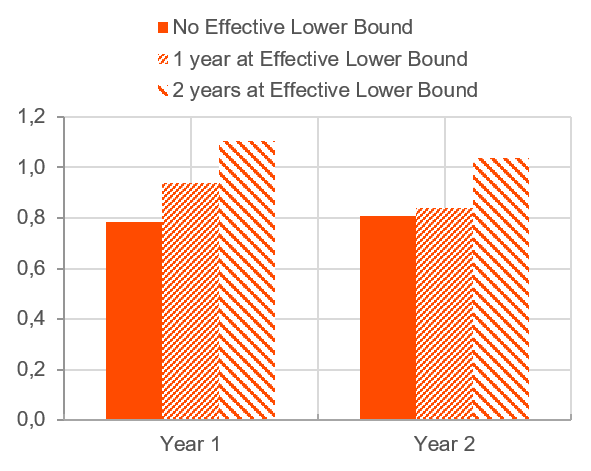
There is a wealth of research showing that fiscal multipliers are larger at the effective lower bound (see Figure 16).16 One reason for this is that fiscal stimulus normally triggers expectations of a tightening of monetary policy, while at the lower bound investors anticipate a prolonged period of low interest rates, thereby accommodating the fiscal response.

Figure 15. Real natural rate (%)
 width=
Source: Holston et al. (2017), “Measuring the Natural rate of Interest: International Trends and Determinants”, Journal of International Economics, Vol.108, Supplement 1, pp. S59-S75.

Figure 16. Government spending multipliers (%)
 width=
Source: ECB.
Notes: In % deviation from steady state levels.
The assumed shock is an increase of the government consumption-to-GDP ratio by 1pp.
Model simulation based on: New Area Wide Model with a range of fiscal instruments, see Coenen et al. (2008), “Tax reform and labour-market performance in the euro area: A simulation-based analysis using the New Area-Wide Model”, Journal of Economic Dynamics and Control, Vol. 32, I. 8, pp. 2543-2583.

The third consequence is that, all other things being equal, the cost of debt has fallen.17

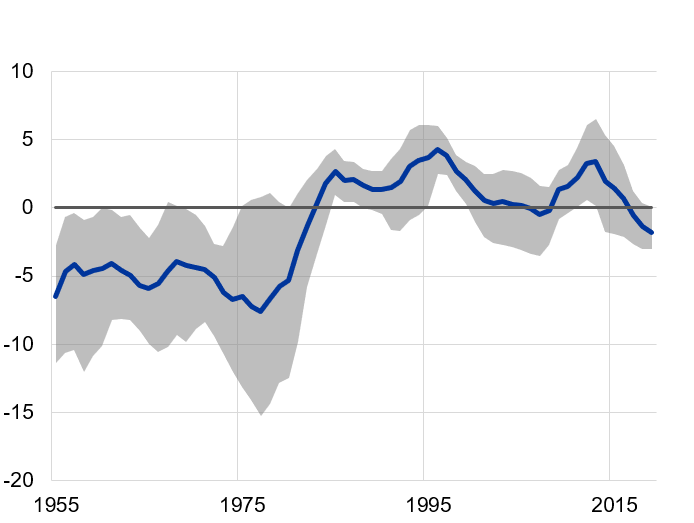
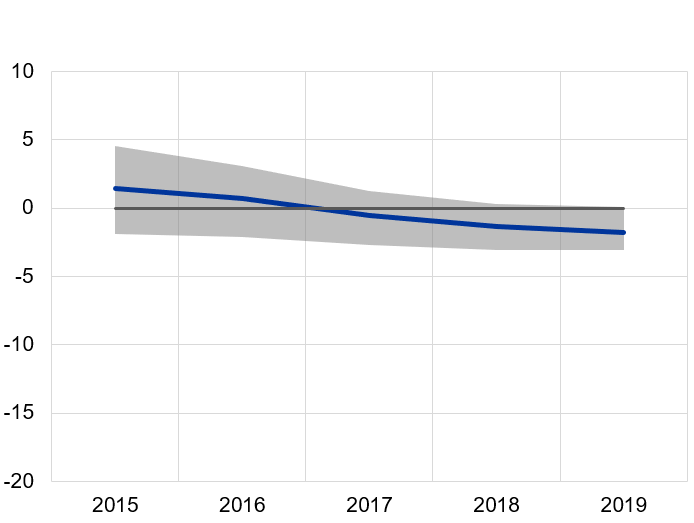
The extent of this drop has been such that countries may no longer need to run primary budget surpluses to stabilise or reduce their debt burden over time as long as interest rates are lower than nominal growth rates (see Figure 17).

As a result, welfare costs of higher debt may be lower today than they were in the past, even more so when public funds are used for investment addressing growing economic externalities, such as climate change or the slow diffusion of new technologies.

But we cannot, and should not, take for granted that current financial conditions will continue indefinitely.

Interest rate–growth differentials have fluctuated widely in the past (see Figure 17). Periods with negative “r-g” have often been followed by periods with positive “r-g”, with measurable consequences for the cost of debt.18


Figure 17
. Euro area interest-growth differential (percentage points)

 width=  width=

Source: European Commission’s AMECO database and Jorda et al. (2017), “Macrofinancial History and the New Business Cycle Facts”, in NBER Macroeconomics Annual 2016, Vol. 31, edited by Martin Eichenbaum and Jonathan A. Parker. Chicago: University of Chicago Press.
Note: Long-term interest rate on government debt minus nominal GDP growth. The grey band represents the minimum and maximum values among DE, FR, IT and ES.

The ECB will be careful to not choke the incipient recovery by initiating a tighter policy too early. But when the crisis has been overcome and inflation has returned to a sustained path towards our aim, the ECB needs to step back, in line with its mandate, and in line with its symmetric target, as it did towards the end of 2018 when the Governing Council decided to end net asset purchases.

This implies that governments will have to make a credible commitment to regain fiscal space once the economy has recovered from the crisis. Debt levels remaining too high for too long will hurt growth and make the euro area more vulnerable. In the past, many countries failed to take advantage of the good times to create a sufficient amount of policy space.

There are two broad and complementary ways to address high debt: by boosting potential growth and by cutting budget deficits. Both will have a role to play.

But there is a clear hierarchy in the sequence: governments must give clear priority to boosting potential growth by directing spending towards productive investment. Public investment in the euro area has been too low for too long, holding back economic growth.

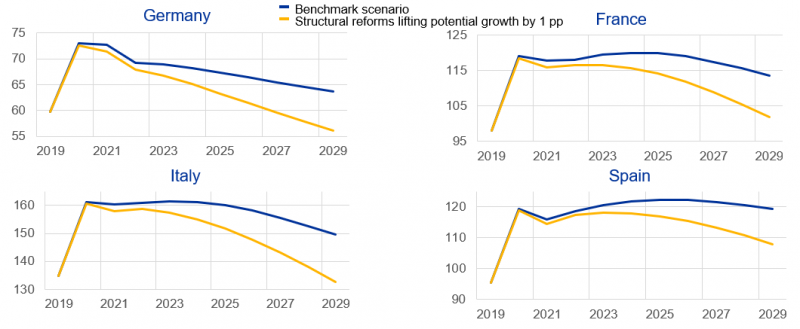
ECB research demonstrates the beneficial effects of higher potential growth on debt dynamics (see Figure 18): an increase in the potential growth rate of 1 percentage point would reduce public debt as a share of output by more than 10 percentage points in some economies.

Fiscal consolidation needs to follow once the recovery has matured. It must reflect the lessons learned from previous crises and should maximise the use of growth-friendly measures.19

Similarly, it should be accompanied by an overhaul of the euro area’s fiscal framework – now more than ever. Fiscal rules are still too complicated, too politicised and too procyclical.

The issuance of joint debt in the context of the European recovery plan in response to the COVID-19 crisis has made a transparent and credible fiscal framework indispensable to enable further steps towards European integration. Failure to produce such a framework could once again threaten to undermine confidence in the cohesion of the single currency area.

Figure 18. Government debt (% of GDP)
 width=
Source: ECB calculations.
Note: Benchmark of compliance with Stability and Growth Pact requirement (blue line). Yellow lines assumes that the economy will improve permanently its potential growth rate by 1 pp as of 2021.

Conclusion

Taken together, the pandemic has not undermined monetary dominance in the euro area. My remarks today have offered evidence that refutes the claim of financial repression. The ECB’s actions remain firmly geared towards its price stability mandate.

I also provided empirical evidence that our unconventional policy measures have not muted market discipline. Risk premia in euro area sovereign bond markets continue to reflect fundamental forces. They are also not materially different from those of their international peers. And when acute periods of stress threaten market stability, central banks are best placed to protect the public from such destabilising forces.

Finally, I have argued that secular trends have changed the interaction between fiscal and monetary policy. Years of weak aggregate demand and a reduction in conventional monetary policy space on the back of the long-term decline in the real natural interest rate have made fiscal policy more important, and more effective, as a tool of macroeconomic stabilisation.

History suggests that society is better off under a regime of monetary dominance. Inflation may not be a serious threat to society at the current juncture. But the factors that motivated central bank independence four decades ago, and the safeguards that were put in place to protect it, remain important pillars of stability and prosperity.

  • 1.

    Speech by Isabel Schnabel, Member of the Executive Board of the ECB, at the Centre for European Reform and the Eurofi Financial Forum on “Is the current ECB monetary policy doing more harm than good and what are the alternatives?”, organised in association with the German Presidency of the EU Council, Berlin, 11 September 2020.

  • 2.

    See Reinhart, C.M. and Sbrancia, M. (2015), “The liquidation of government debt,” Economic Policy, Vol. 30, No 82, pp. 291-333.

  • 3.

    See Nerlich, C. (2018), “The 2018 Ageing Report: population ageing poses tough fiscal challenges”, Economic Bulletin, Issue 4, ECB; Dieppe, A. and Guarda, P. (eds.) (2015), “Public debt, population ageing and medium-term growth”, Occasional Paper Series, No 165, ECB; and European Commission (2019), “United in delivering the Energy Union and Climate Action – Setting the foundations for a successful clean energy transition”, 18 June.

  • 4.

    See The Economist (2019), “The independence of central banks is under threat from politics”, 13 April.

  • 5.

    See, for example, de Larosière, J. (2020), “Negative interest rates cannot save indebted economies”, Financial Times, 20 July.

  • 6.

    See Jafarov, E., Maino, R. and Pani, M. (2019), “Financial Repression is Knocking at the Door, Again. Should We Be Concerned?”, IMF Working Papers, No 19/211, International Monetary Fund.

  • 7.

    On the calibration of the PEPP, see Schnabel, I. (2020), “The ECB’s policy in the COVID-19 crisis – a medium-term perspective”, remarks at an online seminar hosted by the Florence School of Banking & Finance, 10 June.

  • 8.

    See Ferreira, T. and Shousha, S. (2020), “Scarcity of Safe Assets and Global Neutral Interest Rates”, International Finance Discussion Papers, No 1293, Board of Governors of the Federal Reserve System; and Ehlers, T. (2012), “The effectiveness of the Federal Reserve’s Maturity Extension Program – Operation Twist 2: the portfolio rebalancing channel and public debt management”, in Bank for International Settlements, “Threat of fiscal dominance?”, BIS Papers, No 65, pp. 245-255.

  • 9.

    See Woodford, M. (2003), Interest and Prices: Foundations of a Theory of Monetary Policy, Princeton University Press.

  • 10.

    During this period, ECB policy is estimated to have exhibited desirable stabilising properties. In other words, estimated rules have generally been found to be consistent with the Taylor principle. See Blattner, T. and Margaritov, E. (2010), “Towards a robust monetary policy rule for the euro area”, Working Paper Series, No 1210, ECB. Shadow rates are an imperfect and highly model-dependent gauge of the overall monetary policy stance. The measure used here is one example of that rate, based on Lemke and Vladu (2017), while the range of estimates in the literature is fairly wide (see, for example, Wu and Xia, 2017).

  • 11.

    A systematic collection of inflation expectations for the euro area is not available for the period before 1990. The chart shows private sector estimates for the United States that build on research by the Federal Reserve Bank of New York. See Groen, J. and Middeldorp, M. (2013), “Creating a History of U.S. Inflation Expectations”, Liberty Street Economics, Federal Reserve Bank of New York.

  • 12.

    In the case of Greece, although overall debt is considerable, the share of debt held by private sector participants is comparatively low,, which is likely to affect market pricing.

  • 13.

    See ECB (2014), “The determinants of euro area sovereign bond yield spreads during the crisis”, Monthly Bulletin, May.

  • 14.

    See also Schnabel, I. (2020), “Going negative: the ECB’s experience”, speech at the Roundtable on Monetary Policy, Low Interest Rates and Risk Taking at the 35th Congress of the European Economic Association.

  • 15.

    See DeLong, J. and Summers, L.H. (2012), “Fiscal Policy in a Depressed Economy”, Brookings Papers on Economic Activity, Economic Studies Program, The Brookings Institution, Vol. 43, No 1, pp. 233-297.

  • 16.

    See Christiano, L., Eichenbaum, M. and Rebelo, S. (2011), “When is the Government Spending Multiplier Large?”, Journal of Political Economy, Vol. 119, No 1, The University of Chicago Press, pp. 78-121; and Coenen, G. et al. (2010), “Effects of Fiscal Stimulus in Structural Models”, IMF Working Papers, Vol. 10, No 73, International Monetary Fund. The chart shows the response to a 1 percentage point increase in the government consumption-to-GDP ratio, which is maintained over two years before reverting back to its steady state value. The public spending increase constitutes a positive demand stimulus, increasing production and raising prices. When the effective lower bound is binding, agents fully and credibly anticipate that the policy rate does not deviate from its current level for 1 year (or 2 years). The policy rate thereafter follows a standard Taylor-rule. At the effective lower bound, the monetary authority does not increase the nominal interest rate so that the decline in the real interest rate supports private consumption and investment decisions, leading to a more positive overall effect on GDP.

  • 17.

    See Blanchard, O. (2019), “Public Debt and Low Interest Rates”, American Economic Review, Vol. 109, No 4, pp. 1197-1229.

  • 18.

    The interest rate–growth differential is, of course, not a sufficient statistic to describe debt dynamics. Persistent large primary budget deficits could marginalise the effects of low interest rates.

  • 19.

    See ECB (2017), “The composition of public finances in the euro area”, Economic Bulletin, Issue 5.

About the authors

Isabel Schnabel

Isabel Schnabel is a member of the Executive Board of the European Central Bank (ECB) where she is responsible for Market Operations, Research and Statistics. Before joining the ECB, she was Professor of Financial Economics at the University of Bonn (currently on leave) and spokesperson of the Cluster of Excellence “ECONtribute: Markets & Public Policy”. From 2014 to 2019 she served as a member of the German Council of Economic Experts, and in 2019 she was Co-Chair of the Franco-German Council of Economic Experts. Isabel Schnabel received her doctorate from the University of Mannheim and served as Senior Research Fellow at the Max Planck Institute for Research on Collective Goods in Bonn. She was a visiting scholar at the International Monetary Fund (IMF), the London School of Economics, and Harvard University. From 2007 until 2015 she was Professor of Financial Economics at Johannes Gutenberg University Mainz. In 2018 she was awarded the Gustav Stolper Prize of the Verein for Socialpolitik, the association of German-speaking economists. Her research focuses on financial stability, banking regulation, international capital flows and economic history.

More on these topics

Tags: