The views expressed here are the independent opinions of S&P Global Ratings’ economics group, which is separate from but provides forecasts and other input to S&P Global Ratings’ analysts. S&P Global Ratings’ analysts use these views in determining and assigning credit ratings in ratings committees, which exercise analytical judgment in accordance with S&P Global Ratings’ publicly available methodologies. This report does not constitute a rating action.
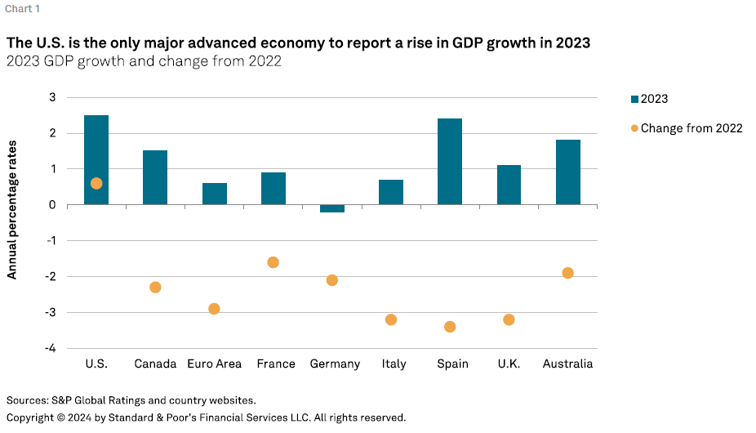
The U.S. economy continues to outperform peers–it was the only major advanced economy where growth rose in 2023 despite the steep increase in policy rates (so Japan is excluded). In our assessment, the strong relative performance of the U.S. reflects a combination of resilience (flexibility and productivity), fiscal policy (loose), lags (monetary transmission), and luck (geography). U.S. growth should eventually slow as monetary policy tightening bites, but some degree of exceptionalism suggests relative outperformance will continue. This would require that recent gains in productivity are sustained.
The U.S. appears to have emerged virtually unscathed from a round of steep policy rate hikes. GDP growth in 2023 rose by 0.6 percentage points from 2022, making the U.S. an outlier among major advanced economies (see chart 1). (We exclude Japan since its policy rate has not changed over the current tightening cycle, remaining at -0.1%.) Indeed, for the countries in our sample, real GDP growth rates declined by over 2.5 percentage points last year. Moreover, given the strong finish to 2023 and good start to 2024, we recently revised our 2024 U.S. GDP growth forecast to 2.4% from 1.5% (see “U.S. Economic Forecast Update: A Sturdy Job Market Keeps Growth Going,” Feb. 21, 2024).
This U.S. outperformance is a mystery of sorts. Policy rate hikes are intended to tighten financial conditions, slow demand, and, therefore, slow GDP growth, all else constant. Indeed, the performance of the other advanced economies–with growth slowing during 2023 as rate hikes worked their way through–is closer to what we were expecting for the U.S. And, since the U.S. Federal Reserve raised its policy rate more than other central banks, the outperformance is even more remarkable.
Is this recent outperformance another case of U.S. exceptionalism? Or are there factors that explain why U.S. growth has held up, at least for now? We looked at five possible explanations: starting position, geography, monetary policy transmission, fiscal policy, and productivity. The answer, in our view, turns out to be a bit more nuanced than much of the ongoing commentary.
Based on our analysis, the U.S. wasn’t clearly in a more favorable starting position than its peers when the rate hike cycle began in early 2022. Specifically, we considered whether excess demand was smaller in the U.S., which would have necessitated a smaller drop in output to bring the economy into equilibrium. If this were the case, then the U.S. could outperform subsequently.
This is essentially a question about the (positive) output gap–a measure of output relative to potential. A positive output gap means an economy is running above its potential, or “running hot,” which would translate to inflation pressures if the proximate cause was excess demand. Similarly, a negative output gap means an economy’s output is below potential.
Output gaps are difficult to measure given that potential GDP may not be well-behaved. Nonetheless, given the similarity of the COVID-19 shock across the U.S. and its peers and the similarity of the subsequent recovery paths, it’s difficult to argue that the U.S. output gap was materially different from its peers. Alternative measures such as the NAIRU (non-accelerating inflation rate of unemployment) gap or capacity utilization also do not suggest a different starting position for the U.S. in early 2022.
In our assessment, geography was a factor in the U.S. economy’s outperformance relative to its peers in recent years. For the matter at hand, this relates to the economic and financial spillovers from Russia’s invasion of Ukraine in February 2022.
Europe and the U.K. had larger terms of trade and confidence shocks resulting from the invasion. Both are more reliant on energy imports so both took a bigger hit in terms of purchasing power and income (see chart 2). Moreover, given Europe’s geographic proximity—particularly Germany–confidence was hit hard, further dampening spending and income. (Australia was arguably affected much less than Europe and the U.K., while Canada likely had the same advantages as the U.S.)
We think that geography gave the U.S. an advantage over Europe in two ways. First, terms of trade and confidence shocks affected the U.S. less because of its larger distance from the conflict. Second, more geology than geography, the U.S. was willing and able to deploy its endowment of natural gas in response to higher energy prices resulting from the conflict. Of note, Germany also has sizable reserves of shale gas, but it has decided not to develop them in the name of the green transition.

The slower transmission of policy rate increases to market rates is a positive for U.S. growth. But this benefit is transitory. For two hypothetically similar economies, the one with the slower passthrough will initially take a lower hit to growth, although that advantage will dissipate over time as rates reset. Moreover, slower passthrough suggests that policy rates may need to stay higher for longer to rein in demand as desired.
Policy rate increases were broadly similar in our sample during 2022-2023. Central banks found themselves behind the curve and were forced to raise rates at the fastest pace and by the largest cumulative amounts in four decades. Despite these broadly equivalent rate rises, the passthrough to market rates and financial conditions can differ markedly. The U.S. has a relatively slow passthrough in our sample of economies, so policy rate rises have a lower immediate impact on activity, boosting short-term performance. Similarly, the European Central Bank (ECB) believes that the transmission of higher rates to the European economy through the banking channel has been “forceful,” as Philip Lane noted in his speech on the transmission of monetary policy in the eurozone (“Monetary policy transmission in the euro area,” Sept. 26, 2023).
This slow passthrough in the U.S. is due to a larger prevalence of fixed interest rates, most notably in mortgages. As a result, the potential loss to after-interest-payment disposable income is more muted, supporting growth. At the other extreme, a recent study from the Organization for Economic Cooperation and Development shows Australia and the Baltic and Scandinavian economies as having among the highest shares of floating mortgage rates.
In addition, the response of personal savings rates to higher interest rates has been different, with Europe saving more and the U.S. saving less.
Many economies loosened fiscal policy to counter the economic effects of the COVID-19 pandemic. In the U.S., this led to a high and rising primary fiscal deficit, which we found did boost growth in 2023 and contribute to outperformance. But the anticipated reduction in 2024 will impart a moderate contractionary fiscal impulse and slow growth.
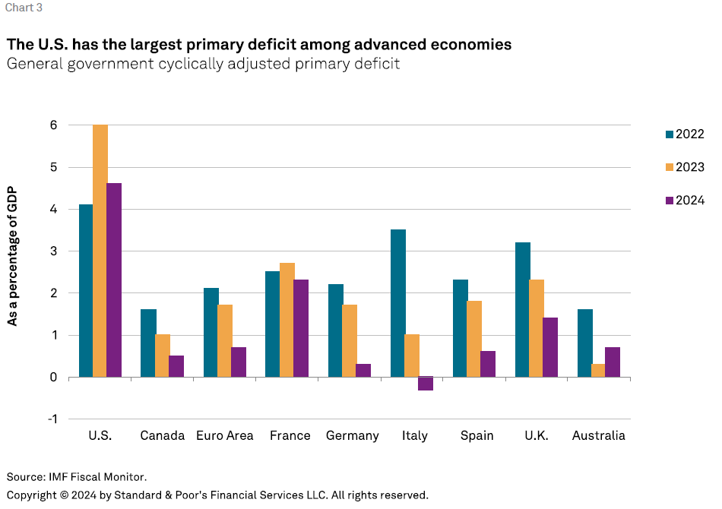
When looking at cyclically adjusted data at the general government level, the U.S. is the clear outlier among advanced economies (see chart 3). The U.S. not only had the largest primary deficit (loosest fiscal stance) in 2022, but it also had the greatest impulse (increase in the deficit) in 2023. Indeed, all others in our sample saw fiscal consolidation last year–led by Italy–with the exception of a slightly larger primary deficit in France. Recent U.S. performance also benefited from the generous 2020-2021 fiscal stimulus, as households were able to build savings buffers that supported consumption and demand growth in subsequent years.
Moreover, the composition of fiscal spending matters. Supply-boosting investment is better than consumption-boosting transfers. Here, the U.S. Inflation Reduction Act and the CHIPS and Science Act have been crowding in private-sector investment as the U.S. seeks to accelerate the energy transition. This arguably lifts potential growth (reducing any positive output gap, see above) and productivity (see below). In the same vein, the ECB has often asked European governments to focus their measures more on the supply side than on safeguarding demand.
The recent increase in labor productivity is a clear positive for the U.S. Labor productivity growth took off during the second half of the year, rising around 4% year on year–roughly equal to wage growth–and therefore holding unit labor costs flat. In contrast, in Europe, productivity growth was fractionally negative and, as a result, unit labor costs rose in line with wages. This U.S. outperformance likely stemmed from a pickup in investment and a multidecade high rate of small business formation, where productivity gains have historically been concentrated.
Higher productivity growth raises GDP growth, all else constant. It also lowers the sustainable rate of unemployment by keeping labor costs lower. While the contribution to recent U.S. outperformance is unambiguously positive, the key question is whether the recent productivity gains can be sustained.
Overall, while a full victory lap may not be justified, there are fundamental reasons the U.S. economy has outperformed its peer group since early 2022–namely, a combination of resilience, policy, lags, and luck. U.S. growth should eventually slow as monetary policy tightening bites, but some degree of exceptionalism suggests relative outperformance will continue.