The views expressed in this article are my own and do not necessarily represent the views of Banca d’Italia or the Eurosystem. The note is based on the Banca d’Italia Occasional paper “There has been an awakening. The rise (and fall) of inflation in the euro area”.
In the summer of 2021, inflation woke up for the first time in many years. The period of low inflation in the euro area ended abruptly with the recovery from the Covid-19 pandemic and the energy crisis. Supply bottlenecks and energy prices played an important role in pushing up core inflation. Despite the rise in consumer prices, the ECB’s monetary policy response helped to re-anchor long-term inflation expectations to the new symmetric 2 per cent target.
“There has been an awakening. Have you felt it?”, Supreme Leader Snoke: Star Wars, The Force Awakens.
In all advanced economies, inflation increased significantly in 2021 and 2022. Between March and December 2022, inflation in OECD countries rose to an average of 10 per cent, up from 1.3 between April and December 2020. In the euro area, inflation rose rapidly from the low levels reached during the height of the pandemic. Headline inflation, as measured by the Harmonized Index of Consumer Prices (HICP, henceforth) reached a peak at 10.6 per cent in October 2022. This is six times the average between 1999 and 2019 (1.7 per cent; Figure 1). In March 2023, core inflation was 5.7 per cent, four times the average between 1999 and 2019 (1.4 per cent).
A reasonable starting point for the beginning of the inflation surge can be identified in the summer of 2021, if one looks at annualised monthly changes in the seasonally adjusted HICP. Since then, inflation has risen rapidly, averaging 9.5 per cent in 2022. After peaking in March 2022 (at 24 per cent), inflation has declined significantly, averaging 3 per cent between January and December 2023.
Figure 1: Headline inflation in the euro area
(per cent)
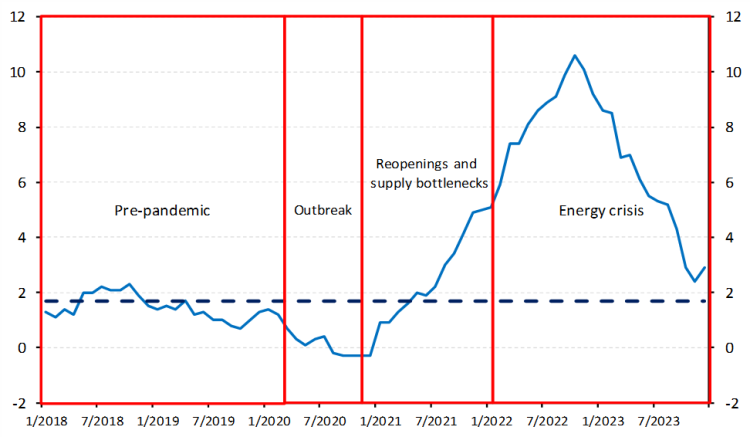
Source: ECB. Note: year-on-year changes in the HICP, monthly data. The dashed line represents the average over the January 1999 – December 2019 period. Latest observation: December 2023.
During the pandemic, consumers shifted towards purchasing goods as the consumption of high-contact and tourism services was severely affected by the containment measures. By late 2020, an imbalance between the demand and the supply of goods quickly emerged. As the global recovery gained momentum, albeit at different rates depending on the spread of the virus and the easing of containment measures, demand for raw materials, intermediate inputs and logistical services outstripped supply, resulting in rising prices and delivery delays.
The Global Supply Chain Pressure Index (GSCPI) developed by the Federal Reserve Bank of New York reached unprecedented levels in late 2021, indicating an increasing number of disruptions in the production and transportation of goods on a global scale. As delivery times, shipping costs and input prices began to rise, pressures mounted in upstream sectors, leading to higher prices for intermediate goods in the euro area (Figure 2, panel a). Bottlenecks were particularly severe in raw materials, semiconductors and other intermediate manufactured goods, as well as freight transport. The prices of raw materials increased significantly due to shortages and the increased demand for building up inventories surged. Shipping costs between Asia and North America soared and delivery times lengthened substantially. Cargos were forced to queue for days to access ports due to containment measures to counter the spread of the virus.
As economies reopened, consumers returned to services, increasing the demand for contact-intensive ones such as restaurants, accommodation and travel. Lane (2022) shows that contact-intensive services have played an increasing role in raising services inflation between summer 2021 and spring 2022, as economies gradually reopened after the removal of the containment measures. The accumulation of savings during the most acute phase of the pandemic contributed to sustaining the demand for contact-intensive services. The increase in energy prices also had a significant impact on service prices.
Figure 2: The role of supply bottlenecks and energy prices
Panel a) Indicators of supply bottlenecks and producer prices
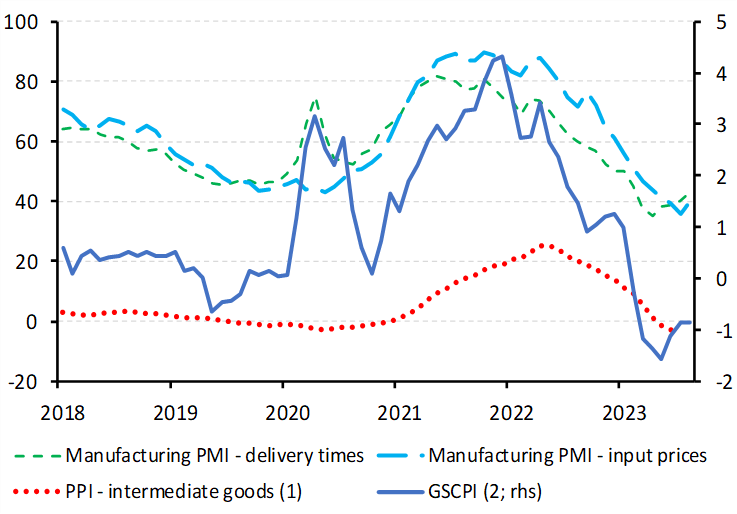 Source: ECB, Federal Reserve Bank of New York and S&P Global. Note: the index integrates transportation cost data and manufacturing indicators to derive a measure of global supply chain conditions. The PMI delivery times is shown in difference from 100, so that an increase captures longer delays. (1) Annual percentage changes. (2) Standard deviations from the index’s historical average. Latest observations: August 2023 except for PPI intermediate goods and the GSCPI (July).
Panel b) Energy contribution to headline inflation
(percentage point)
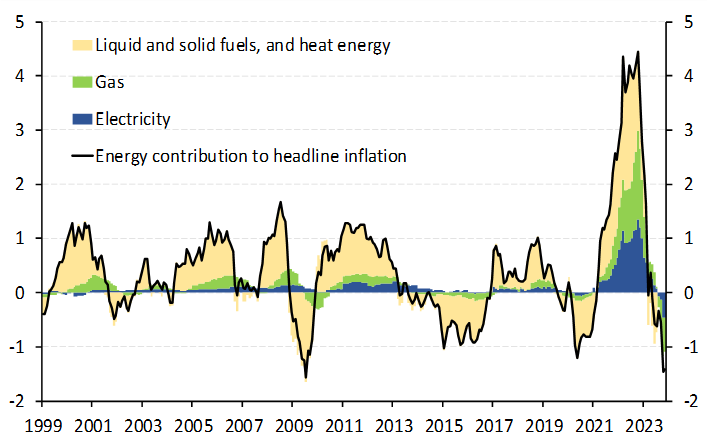 Source: ECB. Note: contributions to year-on-year changes in the HICP. The sum of the contributions amounts to the energy component of the HICP. Latest observation: November 2023.
The Russian invasion of Ukraine in February 2022 led to a significant increase in energy commodity prices, particularly gas prices in Europe, which reached unprecedented levels. In 2022, the average price of Brent oil was 99$/b, up from 70 in 2021. Between March and June, it repeatedly surpassed 120$/b, before declining to below 90 after September, as signals of a slowdown of the global economy intensified. During the summer of 2022, gas prices in Europe surged to €350 per megawatt-hour. This was due to European economies replenishing their stocks to secure minimum supplies for the winter and using gas to generate electricity for cooling systems amidst Europe’s hot summer, and reduced availability of hydroelectric and nuclear energy. Several factors contributed to bringing prices down to below €30, including a mild winter, reduced consumption due to the price increases, government cost-saving measures, and meeting gas storage targets.
The emergence of supply bottlenecks and the unprecedented and persistent increase in the prices of energy commodities led to a perfect storm. In autumn 2022, headline inflation reached double. The energy components of inflation increased their contribution from 0.3 p.p. to 2.1, with a maximum of 4.4 p.p. in October 2022, seven times the average between 1999 and 2020 (Figure 2, panel b). These figures illustrate the magnitude of the shock that the euro-area economy experienced in 2022.
In March 2023, core inflation reached an unprecedented level of 5.7 per cent. The unprecedented and broad-based increase in core inflation suggests that the surge in energy prices may have had substantial indirect effects. Lane (2022) and Panetta (2023a) show that energy-intensive groups of items accounted for an increasing large proportion of non-energy goods and services inflation from mid-2021 to the first months of 2023, despite accounting for only 20 and 30 per cent of the goods and services basket, respectively. Neri et al. (2023) show that the indirect effects of energy prices have been substantial.
Figure 3: The role of supply bottlenecks and energy prices
(per cent and percentage point)
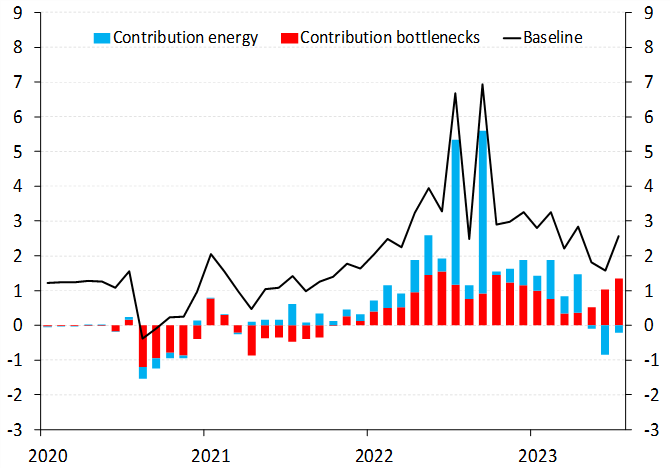
Source: ECB. Note: the blue (red) dotted lines show the path of the inflation rates without energy prices (the impact of supply bottlenecks). The corresponding bars denote the contribution of the two exogenous variables. Latest observation: July 2023.
A simple way to quantify the role of supply bottlenecks and energy prices for core inflation since January 2020 is to estimate equation for core inflation πt:

where SBt is the GSCPI and ENt the monthly changes of energy prices. The error term ɛt is normally distributed with zero mean. The equation is estimated using recursive least squares. The sample goes from January 1999 to June 2023. Once the equation is estimated, the contribution of supply bottlenecks and energy prices is quantified by setting, respectively, β and ϒ to zero and simulating the equation in-sample. The difference between the two paths measures the contribution of the two explanatory variables. Supply bottlenecks and energy prices have been important drivers of core inflation (Figure 3). In 2022, both factors accounted, on average, for, respectively, 2.2 p.p. (1.2 and 1.0, respectively) of core monthly annualized inflation (5.2 per cent).
The large and sustained rise in inflation called for a strong and exceptionally swift monetary policy response by the ECB. The process of normalizing monetary policy started in December 2021, when the Governing Council announced the end of the net asset purchases within the PEPP starting from March 2022 and the gradual reduction of those under the APP from the second quarter of 2023. The decisions regarding the purchase programmes exerted substantial upward pressure on risk-free long-term yields by reducing term premia and strengthening market expectations about the lift-off of the policy rates. Between the beginning of December 2021 and the end of June 2022, the 10-year rate on Overnight Interest Swap increased by 2 p.p., from 0 per cent to 2.
The ECB began raising the policy rates in July 2022. Since then, the pace and scale of the increases have been unprecedented. By September 2023, the policy rates had been raised by 450 b.p., which represents a cumulative increase that is more than twice that observed during the 2005-07 tightening cycle. The unprecedented monetary policy tightening led to a rapid increase in lending rates to non-financial corporations and households, also reflecting the unprecedented speed and scale of the policy rate increases (Lane, 2023), and to a marked decline in credit. Banks began to tighten credit standards at the onset of the monetary policy normalisation, in a context of increasing uncertainty related to the rise in energy prices and the conflict that started after Russia’s invasion of Ukraine. More than a year into the beginning of the monetary policy normalization, credit demand, as assessed by euro-area banks participating in the Eurosystem’s Bank Lending Survey, has declined sharply, particularly for households. The tightening of credit standards, which is driven by banks’ increased risk perception and reduced risk tolerance, may put additional upward pressure on lending rates (Bottero and Conti, 2023).
Setting policy rates at an excessively high level may result in an overly restrictive monetary policy stance, which could raise the likelihood of a recession due to an excessive tightening of financing conditions. Furthermore, a sudden reversal of the stance could damage the credibility of the ECB, which was frequently questioned during the period of low inflation. The duration for which the policy rates are kept at sufficiently restrictive levels is a crucial factor in determining the monetary policy stance once the policy rates have reached their peaks (Panetta, 2023b).
Figure 4: Inflation and real GDP growth projections under alternative policy rate paths
(per cent)
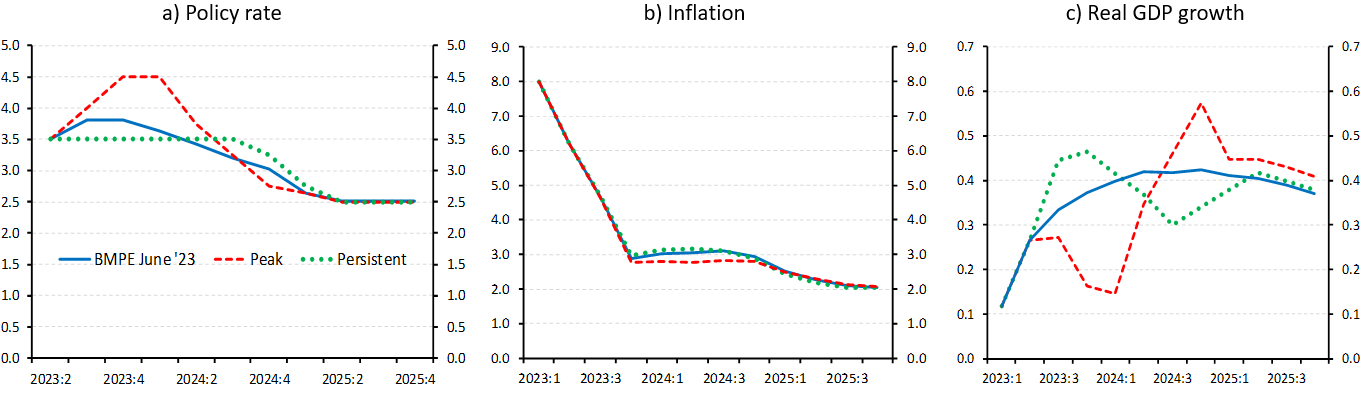
Source: Bartocci, Cantelmo, Cecioni, Hoynck, Notarpietro and Papetti (2023). The two alternative paths, which are chosen in order to ensure that inflation reaches 2 per cent in 2025:Q4, are meant to be illustrative.
Bartocci et al. (2023) employ a DSGE model of the euro area to evaluate the macroeconomic effects of two alternative and illustrative tightening paths for the ECB policy rates that aim to achieve a 2 per cent inflation by the end of 2025. The first path, labelled “persistent”, involves maintaining the current policy rates for an extended period before gradually reducing them. In the more proactive path, referred to as “peak” path, policy rates reach a higher terminal level, but decrease more rapidly (Figure 4, panel a). The simulations show that, compared to the Eurosystem’s June 2023 projections, the persistent path would result in inflation remaining largely unchanged in 2023-24 (panel b), while real GDP growth would benefit from the less restrictive stance in 2023 (panel c). The “persistent” path minimises the output cost. The “peak” path is only preferred in an extreme and unrealistic scenario where the central bank disregards output fluctuations.
In slightly more than a year, headline inflation has fallen from just above 10 per cent to 3 per cent in December 2023. A large part of the decline was due to energy and food prices. A number of indicators of underlying inflation have been exhibiting a moderating trend since the beginning of 2023. By exploiting the correlation between these indicators and the leads of core inflation, it is possible to project forward the latter over the next quarters. In the summer of 2023, core inflation was expected to gradually decline from the peak reached in the spring of 2023. The observed developments in the indicators of underlying inflation provided support for the Eurosystem’s June 2023 projections, which foresaw a decline in both headline and core inflation, which would reach values close to 2 per cent by in the course of 2025.
The rapid disinflation has occurred prior to the full realization of the effects of the monetary policy restriction on aggregate demand, which suggests that the unprecedented supply-side shocks were the cause of the sharp increase in inflation. As these effects materialize, the convergence of inflation to the 2 per cent target will continue and strengthen. The pace of the disinflation since the peak of headline inflation in October 2022 has been somewhat faster than its increase since spring 2021. Indeed, the slope of the linear trend estimated using headline inflation between May 2021 and October 2022 is larger in absolute value than the slope between November 2022 and November 2023.
In the summer of 2021, inflation in the euro area woke up after many years below target. The period of low inflation, which began in 2013, ended abruptly with the economic recovery from the pandemic and the energy crisis. By autumn 2022, inflation in the euro area had reached double digits. Despite the unprecedented rise in consumer prices, long-term inflation expectations have remained anchored at the 2 per cent symmetric target and second-round effects have not materialized.
The monetary policy cycle has peaked and financing conditions are much tighter than at the beginning of the cycle, in part due to banks becoming less willing to take on excessive risks in lending. The impact of the monetary policy tightening through the banking sector is may strengthen and affect aggregate demand over the next two years.
Bartocci, A., A. Cantelmo, M. Cecioni, C. Höynck, A. Notarpietro and A. Papetti (2023). “Approaching the terminal rate and the way forward: a model-based analysis”, Banca d’Italia Occasional paper 791.
Bottero, M. and A. M. Conti (2023). “In the thick of it: An interim assessment of the transmission of monetary policy tightening to credit conditions”, Banca d’Italia Occasional paper 810.
Lane, P. R. (2022). “The euro area outlook: selected issues”, conference to mark the 20th anniversary of the creation of the Germán Bernácer Prize organised by Observatorio del Banco Central Europeo (OBCE), CEPR and Fundación Ramón Areces, 25 May 2022.
Lane, P. R. (2023). “The banking channel of monetary policy tightening in the euro area”, remarks at the Panel Discussion on Banking Solvency and Monetary Policy, NBER Summer Institute 2023 Macro, Money and Financial Frictions Workshop, 12 July 2023.
Neri, S., F. Busetti, C. Conflitti, F. Corsello, D. Delle Monache and A. Tagliabracci (2023). “Energy price shocks and inflation in the euro area”, Banca d’Italia Occasional paper 792.
Neri, S. (2024). “‘There has been an awakening’. The rise (and fall) of inflation in the euro area”, Banca d’Italia Occasional paper 834.
Panetta, F. (2023a). “Everything everywhere all at once: responding to multiple global shocks”, The ECB and its Watchers XXIII Conference, Frankfurt am Main, 22 March 2023.
Panetta, F. (2023b). “Getting disinflation right”, speech at Bocconi University, Milan, 3 August 2023.