The ECB has fallen behind the curve. Despite accelerating inflation, including core inflation, it stuck to an extremely expansionary stance based on forecasts that inflation would return to slightly below its 2% target within two years. This was based on models which yield a forecast that inflation will return to below 2% whatever current inflation invite endless procrastination. In this sense, ECB policy is ‘model-driven’ – and the assertion of the ECB that its normalisation path will be ‘data-driven’ is meaningless unless the ECB abandons the old models with their hardwired low-inflation end point.
This raises two questions:
With the benefit of hindsight, it is easy to criticise the ECB for the very large under-prediction of inflation in the first quarter of 2022. As of end-2021, it was not possible to anticipate the continuing increase (even acceleration) of energy prices in early 2022.
However, one can criticise the ECB for basing its monetary policy decisions on models that seem hardwired to produce, under almost any circumstance, inflation forecasts slightly below the ECB’s target of 2%. With its own forecasts always ending with inflation below target, the ECB acquired a dovish bias.
The models used by the ECB imply that even if energy prices drive headline inflation up to 8%, at the end of the forecast horizon inflation would return back ‘automatically’ anyway (i.e. without any policy change) to slightly below 2%. How is this possible? Inflation would return to the status quo ante, naturally only if the ‘temporary’ spike in inflation does not lead to higher prices for other goods and in particular if wages remain at the same level.
Both conditions are highly unlikely. An energy shock can be expected to have an impact on core inflation through increasing the input costs of many goods and services related to non-food and non-energy sectors. This has happened regularly in the past. Our estimates show a long-term ‘pass-through’ factor of 0.05 from domestic energy prices into core inflation in the euro area (see below). The pass-through is thus rather low, but it become relevant with the unprecedented increase in energy prices observed over the last year. A factor of only 1/20 implies that an increase of 40 percentage points of the energy (component of HICP) inflation translates into 2 percentage point increase in core inflation. The ECB should thus have expected a substantial increase in core inflation, which is known to be stickier than headline inflation.
The implicit assumption that wages would not move strains credulity. European workers are highly unlikely to accept a loss of purchasing power of 7-10% without demanding any compensation. Wage demands have recently crept up considerably across all of the euro area, including double-digit increases in minimum wages in several countries and an initial wage demand of an 8% increase by the influential metal workers union IG Metall in Germany. This could have been anticipated.
The slowly mounting militancy of trade unions is understandable given the fact that Europe’s industry enjoys high profits because euro area producers were able to offset two thirds of the increase in energy and commodity prices in export markets by increasing the prices of their own products, thus protecting their profit margins. It is unlikely that workers will acquiesce to this distribution of income.
The models used by the ECB imply that any wage pressure would be neutralised because the models assume explicitly that the ECB has an inflation target of 1.9% and that this will be reached because rational agents assume that it will be reached.2
Calibrating the long-run inflation mean at 1.9% is in line with the New Area-Wide Model in which, prior to the adoption of the ECB’s new inflation target of 2%, the central bank’s long-run inflation objective was set to 1.9 % per annum.
This suggests that the ECB set itself a trap when it increased its inflation target to 2% in 2021 but failed to change the terminal rate from 1.9% to 2% in its models. If it had done so, its models would have signalled inflation right on (the new) target and it would have had a reason to start normalising earlier.
We conclude that after almost 20 years of ‘lowflation’ the models used by the ECB have been hardwired to deliver inflation forecasts a bit below 2% two years out. Since the ECB is setting its policy on the basis of its own forecasts of inflation for this time horizon, this has created a strong bias to keep an expansionary policy even as inflation tops 7%.
Another example how the approach of the ECB is guaranteed to yield inflation forecast slightly below the (new) target level concerns the interpretation of inflation-linked swaps (ILS). In 2014 the ECB used the 5/5 forward inflation swaps (i.e. the 5-year inflation rate expected 5 years in the future) to justify QE (when oil prices were falling strongly). This indicator has hovered above 2% since mid-2021. At first sight this level would have supported starting normalisation already during the second half of 2021.
Today the ECB argues that a long-term asset like the 5/5-year ILS also contains a risk premium and that the 5/5 inflation swap rate is determined not only by future expected inflation, represents the sum of expected inflation and a risk premium. Expected future inflation could be much lower than the 5/5 inflation swap rate if this risk premium is high. Unfortunately, the risk premium cannot be observed directly. It must be estimated indirectly, making assumptions about market structure, and in particular making an assumption concerning the end point for inflation. The ECB uses two slightly different models, but both imply that the short-term ILS rate converges on a fixed number over the long run, as will any stationary term structure model. As this endpoint is hard to pin down empirically, the ECB has calibrated it to 1.9% – i.e. its old target (see also the quote above).
This seemingly technical assumption is key, as it implies that the ECB has hardwired the expectations of future 5/5 inflation to be below 1.9 % under almost any circumstance.
Figure 1 from ECB (2021) below shows the results of this approach. The blue lines show the raw market values whereas the yellow lines show the expectations component derived from the market values by subtracting the risk premia as calculated by the ECB. The risk adjustment of the 5/5 year inflation swap results in a very stable expectations component around 1.9%3 – rendering this market based indicator useless.
Figure 1: Market-based inflation measures – inflation-linked swap rates
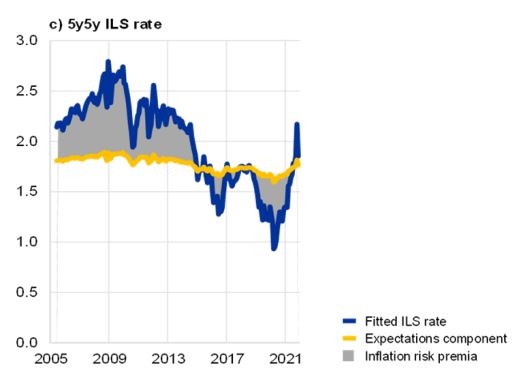
Source: ECB (2021).
Given this assumption that the endpoint of the model describing the inflation swaps is slightly below 2%, the ‘risk-premium-adjusted’ inflation swaps presented by the ECB thus almost always show that expectations remain solidly anchored.4
Other market-based indications of inflation expectations, like the break-even rates calculated from inflation protected and non-inflation protected bonds of the same maturity are less affected by the end-point problem that arises from the risk adjustment to inflation swaps because the two bonds whose yield is compared should share the same risk premium. Alcidi et al. (2022) discuss different market-based and other indicators of inflation expectations. The most widely used alternative market-based measure is the one based on French bonds, ‘OATs’, which as of late May indicate an average expected inflation rate until 2030 of about 3% (Alcidi et al., 2022)5.
The model(s) used by the ECB assumed an ‘automatic’ return of inflation towards the end point of 1.9 because the ECB could only assume that its policy was credible. But this set-up was clearly out of touch with the real world if one combines the abundant evidence that energy prices tend to spill-over into core inflation and the extreme increase in energy prices.6
We thus first estimated the empirical relationship between the energy component of the HICP and core inflation. We found higher that each percentage point increase in the energy component of the HIC leads toa an increase in core inflation of 0.05. The size is small, but statistically very robust, which is in line with the literature. It is not surprising to find that higher energy prices increase core inflation because energy enters the production of many goods and services. This is thus not just a purely statistical relationship.
Moreover, we estimated the impact of the international price of oil (and gas) in euro on the sub-index ‘energy’ of the HICP. The energy component of the HICP can naturally be well explained by oil and gas prices.
These two relationships allowed us to conduct two simulation exercises with two scenarios, concerning the international gas and oil prices: constant at the level of a) 2021m12, and b) 2022m3-m57.
The first one reflects the information available to the ECB as of end 2021. Based on the estimated relationship between the energy component of the HICP and global gas and oil prices, one can simulate the development of the energy component of the HICP under this scenario. The scenario of constant oil prices also gives us a forecast for core inflation. We could thus build up a simulation of the full HICP using the weights assigned to energy in the HICP.
As depicted in the charts below, the results imply that at with the information available at the end of 2021, one could foresee an inflation rate of 2.8% and 2.2% for 2022 and 2023, respectively. There was thus a strong case for starting the normalisation of policy already at the end of 2021.
The case for tightening policy became of course much stronger in early 2022.
Using the data for global gas and oil prices, as of the third and fifth month of 2022 respectively, our approach predicts inflation persisting above 6% through the end of 2022, and moderating only to 3.5% at the end of 2023, even assuming that energy prices remain constant. This contrasts with the 2.1 % the ECB continues to see for the end of its forecast horizon.
The simple statistical model employed here can only be suggestive of a trend. But it shows that if the ECB would have had a reason to start normalisation earlier and to act more decisively now if it did not rely on its models which are hard wired to produce low inflation at the end of the forecasting period.
Figure 2: Development of the HICP and HICP energy inflation
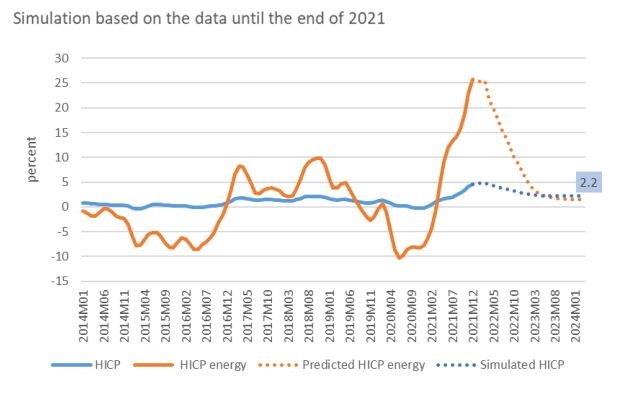
Source: authors’ calculations based on IMF and Eurostat data.
Note: the numbers represent the 3-months rolling average of annual rate of change. In this simulation it is assumed that core inflation stays constant at its level of 2021m12.
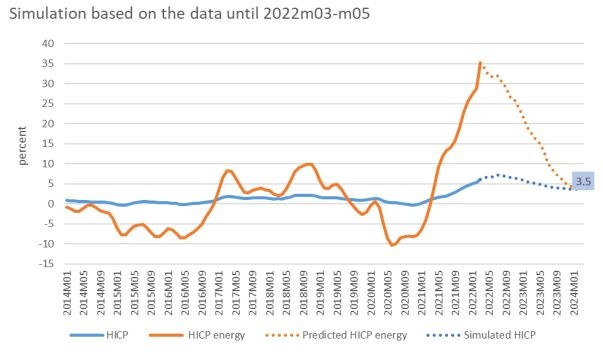
Source: authors’ calculations based on IMF and Eurostat data.
Note: the numbers represent the 3-months rolling average of annual rate of change. In this simulation it is assumed that core inflation stays constant at its level of 2022m03-m05.
A key corollary of the ECB model-based policy setting with a predetermined endpoint is that new information about inflation or the economy has little impact on the policy setting, since this new information would be unlikely to change the inflation rate at the end of the forecast horizon. These models were possibly effective in the past, in a prolonged period of too-low inflation, but in the current situation and in the presence of large shocks the current policy setting would thus appear to remain adequate unless important input into the model is changed.
Alcidi, C., Gros, D. and Shamsfakhr, F. (2022). ‘Inflation expectations: models and measures’. Publication for the committee on Economic and Monetary Affairs, Policy Department for Economic, Scientific and Quality of Life Policies, European Parliament, Luxembourg, 2022.
https://www.europarl.europa.eu/RegData/etudes/IDAN/2022/703338/IPOL_IDA(2022)703338_EN.pdf
ECB (European Central Bank) (2021). ‘Decomposing market-based measures of inflation compensation into inflation expectations and risk premia’, prepared by Burban et al. in ECB Economic Bulletin, Issue 8/2021.
Gros, Daniel and Farzaneh Shamsfakhr (2022) “The ECB’s normalisation path Model- rather than data-driven”, CEPS, June 20th 2022, https://www.ceps.eu/ceps-publications/the-ecbs-normalisation-path/
See also below, the footnote to the ECB Economic Bulletin 8/2021.
Perhaps not coincidentally this corresponds exactly to the old formulation of ‘below, but close to 2%’.
The latest data are available here: https://www.aft.gouv.fr/en/oateuroi-key-figures .
Global price of natural gas in EUR is available until 2022m03.