We compare networks constructed using five commonly used methods and publicly available daily market data to networks based on reported exposures along several dimensions of the balance sheet, i.e., loans, bonds, equity. Our findings suggest that while the global network structure remains stable, individual exposures are more dynamic. The main message from the regression analysis is that the market-based networks do their job relatively well; however, various market-based networks capture different types of exposures. All the measures reflect common portfolios of bonds and loans. Equity-based measures match better direct and indirect equity, while credit-risk measures capture direct bonds. None of the measures robustly identify direct interbank lending.
The 2008-2009 financial crisis attracted attention to the intertwined nature of the financial system. The initial shocks spread widely within the financial systems and across the borders via connections between financial institutions. Following the crisis, central banks invested heavily in collecting granular data on bilateral exposures among banks. Furthermore, network and contagion analysis became a key tool to assess and monitor the stability of a financial system. Currently, if a specific institution, an economic sector or a country experiences stress, central banks can promptly assess the exposure of their financial system towards the troubled counterparty.
These data though have two disadvantages: they are available with a delay and highly confidential with access by only a small circle of regulators and researchers. To address these limitations, several methods to reconstruct networks using publicly available data have been proposed. Earlier work focused on reconstructing bilateral exposures using partial balance sheet data (Anand et al, 2018), while more recent studies explored market data with an advantage of being free, easily accessible and, more importantly, available in real time (Hale, 2014). The reconstructed networks are often used to assess risks due to interconnections and, in particular, to run contagion analysis. For example, the International Monetary Fund applies the approach by Diebold and Yilmaz (2014) to analyze the stability of a banking system in the Financial Sector Assessment Program.1
The question that we ask in this paper (Craig et al., 2023) is how well reconstructed networks reflect true exposures. We investigate this question empirically by employing granular proprietary data on interbank exposures and portfolio holdings of 62 major European banks, representing more than 70% of the total assets of the banking system, from 2013q3 to 2019q4. We use the COREP Large Exposures data set and Securities Holdings Statistics (SHS-G) to construct networks of bilateral interbank loans and securities holdings, respectively. We distinguish between direct networks, representing exposures of one bank to another, and indirect networks reflecting exposures of two banks to a common set of counterparties. To construct market-based networks, we rely on five well-known methods that focus on various aspects of the market data: co-movement of volatilities and returns by Diebold and Yilmaz (2014) and Demirer et al., (2018) – DDLY further on; partial correlation of equity returns by Craig and Saldias (2016) – CS; tail risk in equity returns by Hautsch et al. (2014,2015) – HSS; partial correlation of idiosyncratic default intensities using the CDS contracts by Brownlees et al. (2020) – CDS; partial correlation of forward-looking probabilities of default by Chan-Lau et al. (2016) – PD.
We find that all the market-based networks capture mostly indirect exposures reflecting essentially common business models among banks as such information is more easily available to public investors. Market-based networks also specialize by capturing better certain exposures depending on the nature of the data used. None of the market networks represents correctly direct interbank loans that often serve as an input to the interbank contagion analysis. This is potentially due to proprietary nature of the information, its unavailability to the market, and tiny share of banks’ exposures in total banks’ portfolios. The policy implication suggested by these findings is that one should be careful in choosing the right market data to match the objective of the exercise on the reconstructed network.
We compare networks using three approaches: visually, using global network characteristics and by analyzing how well each specific link, both its existence and size, is matched in two networks.
Visually (Fig. 1) we observe that reconstructed networks significantly differ from one another. Notably, DDLY network is complete while CS network is extremely sparse; however, both networks demonstrate well-identified clusters of banks within the same countries. PD network, on the other hand, shows stronger relationships between individual pairs of banks, rather than country-specific relationships. The networks also vary significantly over time, with certain links being more pronounced particularly during turbulent times. For the sake of example, we plot networks produced only by three approaches; for confidentially reasons, we do not plot true-exposure networks.
Figure 1: Visual presentation of market based networks
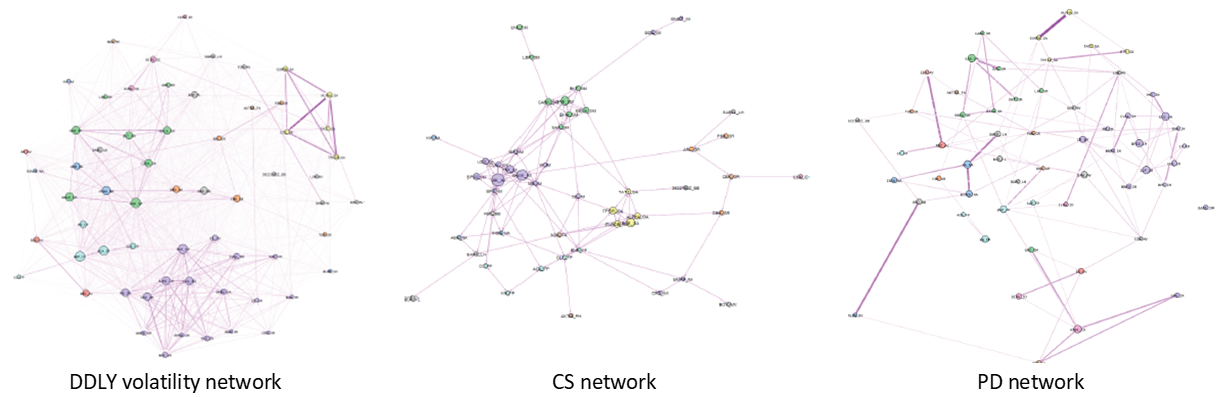
Note: Sample of 62 European banks. Nodes corresponds to banks, node size reflects weighted degree, node colour – country, nodes are located according to the Fruchterman-Reingold + circle pack algorithm, edges size and colour – pairwise directional connectedness (to and from).
Global network characteristics (Figure 2) lead us to the following conclusions. First, density of networks – ratio of existing links over potential links – vary across networks but mostly stable over time. As expected, networks based on direct bilateral exposures (DL, DB, DE, DP) are relatively sparse. Only HSS network and certain PD networks exhibit comparable density, while CS is much sparser and DDLY and CDS are almost complete networks. Despite their sparsity, all networks are well connected as any bank can be reached via, on average, only two links (average shortest path). These and other network properties coincide with studies on financial networks (see, i.e., Anand et al., 2018) and indicate that direct networks exhibit a hub structure where few banks are extremely well connected to the rest of the system, while the majority of the banks have very few connections. Establishing and maintaining direct links is costly, particularly in lending (Craig and Ma, 2022), thus the observed low density of direct lending network. Purchasing securities on the markets such as bond and equity is cheaper, and it leads to higher density in DB and DE networks. Networks of indirect exposures, through portfolio commonality, (IL, IB, IE, IP) are even denser as two banks can get exposed to the same portfolio of assets more easily.
Figure 2: Global network characteristics: Density and Average shortest path
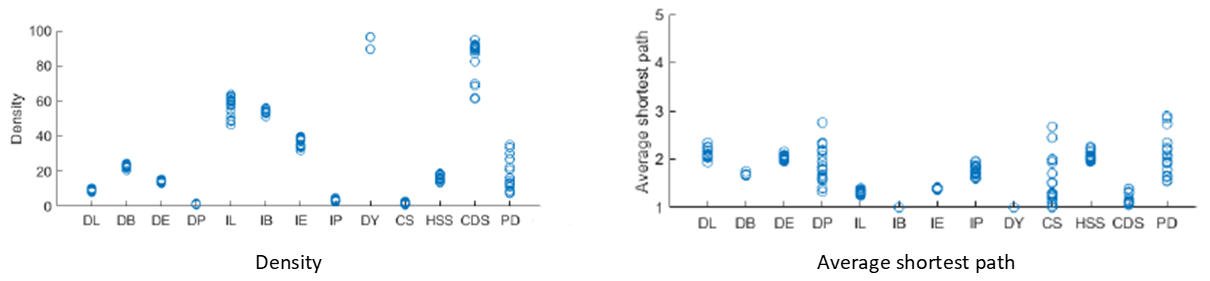
Notes: X-axis presents different networks. Balance-sheet networks of bilateral loans, bonds, listed equity and non-listed equity: DL, DB, DE, DP. Balance-sheet networks due to common portfolio exposures in loans, bonds, listed and non-listed equity: IL, IB, IE, IP. Market-based networks: DY – DDLY volatility network, CS – partial correlation network based on equity return, HSS – tail risk network, CDS – credit risk network, PD – default probability network. Each circle represents characteristics for each quarter from March 2014 to September 2019.
In our econometric analysis, we investigate how accurately market-based networks reflect the true financial connections between banks. By applying the logit model, we assess the likelihood of a connection existing between two banks – extensive margin, while the Poisson model measures the strength of these connections – intensive margin. To allow for econometric interpretation and comparability between coefficients, Fig. 3 presents marginal effects of the regressors. Each coefficient can be read as follows: for example, an increase in the strength of links in the indirect loans network (IL) by one standard deviation leads to an increase in the probability of observing a link and an increase in the size of a link in the default probability (PD) network by 4% and 8,9% respectively.
Figure 3: Magnitude of the effect of an increase in balance sheet exposures between banks on connections observed in the market-based networks
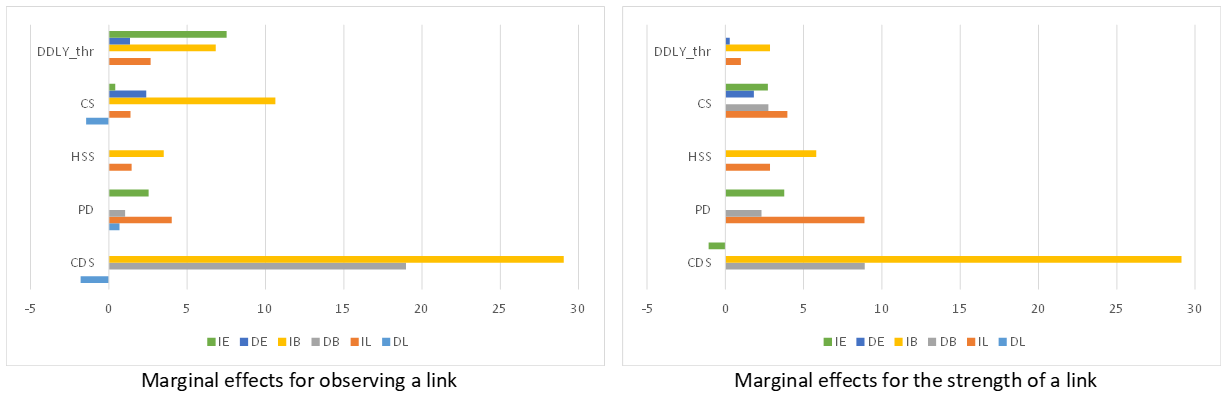
Note: The charts present marginal effects of the coefficients in the logit (left chart) and the Poisson (right chart) regressions. Each bar corresponds to the coefficients significant at 10%. DDLY_thr corresponds to the DDLY network with links below certain threshold put to zero, as we cannot estimate a logit model and compute marginal effects at density on a complete network.
Figure 3 shows that CDS captures the best indirect and direct bonds (IB and DB), also with the largest marginal effects across all regressors. This result is remarkably in line with the fact that CDS contracts often use non-repayment of bonds as a trigger of credit event. The default probability (PD) network is particularly associated with the interbank loans (IL) and direct bonds (DB), with the results being even stronger in estimating the link size. This finding is consistent with the fact that banks’ lending portfolio represents the largest share of their balance sheet and potentially has a strongest effect on banks’ profitability and probability of default. Interestingly, the PD network captures also the commonality in equity portfolios (IE) reflecting a possibility that high volatility in equity prices may affect banks’ default probability.
Moving to the equity-based networks, we observe that all the three approaches capture well commonalities in loan and bond portfolios (IL and IB). HSS network with the focus on tail risk in equity returns and CS network perform better on estimating the intensive margins with CS reflecting all types of exposures except indirect bonds (IB) and direct interbank loans (DL). CS and DDLY are the only two approaches that demonstrate somewhat different results in identifying presence and size of links. Notably, DDLY works well in capturing existence of links in indirect bond (IB) and equity (IE) networks and to a smaller effect in indirect loans (IL) and direct equity (DE) exposures, but not as well for strength of connections.
The market-based networks capture mostly indirect exposures reflecting essentially common business models among banks. Indirect bond and loan portfolios, constituting the largest share of banks’ balance sheets, are the links most often represented in the market-based networks. The nature of market-based networks helps them capture different types of exposures. Namely, equity-based measures match better direct and indirect equity, while credit-risk measures capture direct bonds. None of the market networks represents correctly direct interbank loans. These findings and the fact that market data usually provide a picture only on a subset of the financial system suggest that the choice of the data and of the reconstruction method should be carefully matched with the objective of the exercise on the reconstructed networks.
Anand, K., van Lelyveld, I., Banai, Á., Friedrich, S., Garratt, R., Hałaj, G., Fique, J., Hansen, I., Jaramillo, S. M., Lee, H., & others. (2018). The missing links: A global study on uncovering financial network structures from partial data. Journal of Financial Stability, 35, 107–119.
Brownlees, C., Hans, C., & Nualart, E. (2020). Bank Credit Risk Networks: Evidence from the Eurozone. Journal of Monetary Economics.
Chan-Lau, J. A., Chuang, C., Duan, J.-C., & Sun, W. (2016). Banking network and systemic risk via forward-looking partial default correlations. Research Paper of the National University of Singapore Risk Management Institute.
Craig, B., Karamysheva, M., and Salakhova, D. (2023). Do market-based networks reflect true exposures between banks? ECB Working paper series, No. 2867.
Craig, B. R., & Ma, Y. (2022). Intermediation in the interbank lending market. Journal of Financial Economics, 145(2), 179–207.
Craig, B., & Saldias, M. (2016). Spatial dependence and data-driven networks of international banks. International Monetary Fund.
Demirer, M., Diebold, F. X., Liu, L., & Yilmaz, K. (2018). Estimating global bank network connectedness. Journal of Applied Econometrics, 33(1), 1–15.
Diebold, F. X., & Ylmaz, K. (2014). On the network topology of variance decompositions: Measuring the connectedness of financial firms. Journal of Econometrics, 182(1), 119–134.
Hale, G. (2014). Comment on “Forecasting systemic impacts in financial networks.” International Journal of Forecasting, 30(3), 795–796.
Hautsch, N., Schaumburg, J., & Schienle, M. (2014). Forecasting systemic impact in financial networks. International Journal of Forecasting, 30(3), 781–794.
Hautsch, N., Schaumburg, J., & Schienle, M. (2015). Financial network systemic risk contributions. Review of Finance, 19(2), 685–738.
IMF.FSAP.Germany. (2016). Stress testing the banking and insurance sectors — technical note. IMF Country Report No. 16/191.
IMF.FSAP.Norway. (2015). Technical note — linkages and interconnectedness in the Norwegian financial system. IMF Country Report No. 15/256.
IMF.FSAP.Spain. (2017). Technical note—interconnectedness and spillover analysis in Spain’s financial system. IMF Country Report No. 17/344.
For instance, IMF.FSAP.Norway (2015), IMF.FSAP.Germany (2016), IMF.FSAP.Spain (2017).