menu
close

Author(s):

Alexander Al-Haschimi | European Central Bank (ECB)
Apostolos Apostolou | International Monetary Fund (IMF)
Andres Azqueta-Gavaldon | Arcturis Data
Martino Ricci | European Central Bank (ECB)

Keywords:

China , financial risk , textual analysis , machine learning , topic modelling , LDA

JEL Codes:

C32 , C65 , E32 , F44 , G15

The paper was written while the author was at the European Central Bank.

We summarize the findings of our recent ECB working paper, which develops a measure of overall financial risk in China by applying machine learning techniques to textual data. A pre-defined set of relevant newspaper articles is first selected using a specific constellation of risk-related keywords. Then, we employ topic modelling based on an unsupervised machine learning algorithm to decompose financial risk into its thematic drivers. The resulting aggregated indicator can identify major episodes of overall heightened financial risks in China, which cannot be consistently captured using financial data. A structural VAR framework is employed to show that shocks to the financial risk measure have a significant impact on macroeconomic and financial variables in China and abroad.
Since the Global Financial Crisis (GFC), financial risks in China have been accumulating, however monitoring financial risk in the world’s second-largest economy remains a challenging task. We augment the set of available risk indicators by developing a measure of financial risk by applying machine learning techniques to a large number of newspaper articles. Specifically, the text data was sourced from the US print edition of the Wall Street Journal and the South China Morning Post, a Hong Kong-based newspaper that covers mainland China extensively, via the Dow Jones Factiva database. The text data we analyse cover the period 1 January 2005 to January 2022 and all articles relating to financial risks in China were downloaded. The articles filtered geographically are around 10,000 per year over an average of around 68,000 articles published in both newspapers yearly in the sample period considered.
To identify articles relating to financial risks, we filtered for a set of words contained in the article. To obtain this list of words, we started with the words ‘risk’ and ‘financial’ as well as permutations of these terms such as risks, riskiness, etc. We then generated a list of words that are semantically similar using the word2vec algorithm created by Mikolov et al. (2013).1 The word2vec algorithm was applied to a training sample of 1,000 articles for 2015, which was a year in which China experienced elevated volatility in its exchange rate, capital flows as well as in economic growth rates. The algorithm generated 100 words that were most similar to ‘risk’ and ‘financial’, and judgment was used to reduce this list to those words that were relevant both in meaning and sentiment.
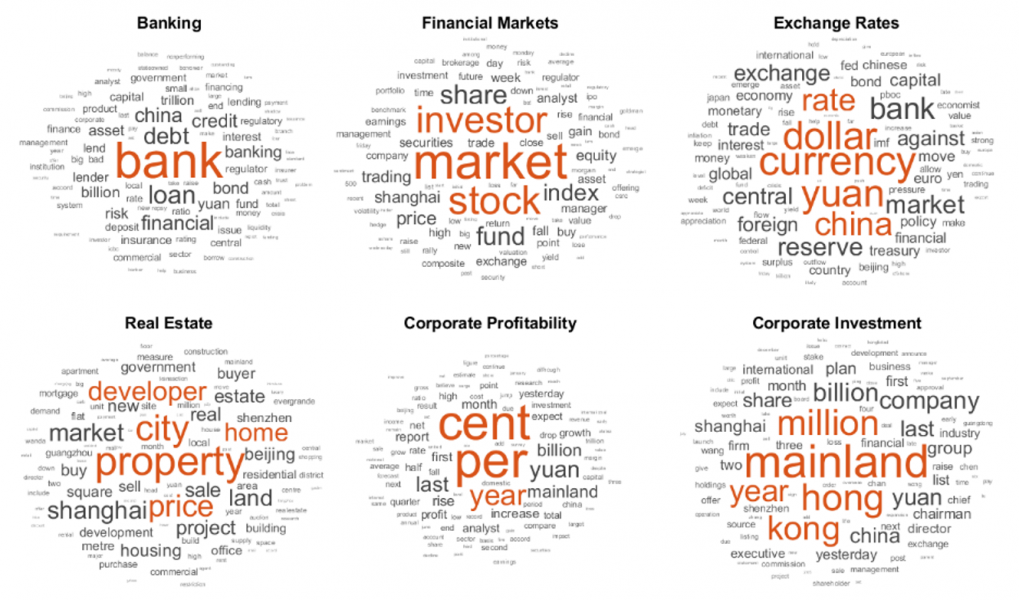
In order to characterise the different topics or themes embedded in this corpus, we apply an unsupervised machine learning algorithm to the selected number of news articles. Specifically, we use the Latent Dirichlet Allocation (LDA), as developed by Blei et al. (2003). Intuitively, the algorithm studies the co-occurrences of words across articles to frame each topic as a distribution of words with a specific probability of belonging to a given topic. Each article, in turn, is represented by a distribution of topics. Our labelling is based on the frequency of words as well as reading representative articles of the identified topics. For example, in the figure below we see the 6 topics we use to construct our aggregated financial risk indicator. The size of the word corresponds to the importance of that word in the topic (i.e. how well does this word represent this particular topic). We clearly see words connected to the exchange rates such as ‘currency’, ‘yuan’, ‘dollar’, or ‘rate’ while other words such as ‘bank’, ‘loan’, or ‘credit’ form a different topic related to banking. Hence with this method we can understand the different themes and their contributions to the aggregate financial risk indicator.
Figure 1: Representative Topics
 width=
Source: Authors’ calculations.
Notes: The size of the words in the word clouds reflect the number of occurrences of that word in the topic considered. 
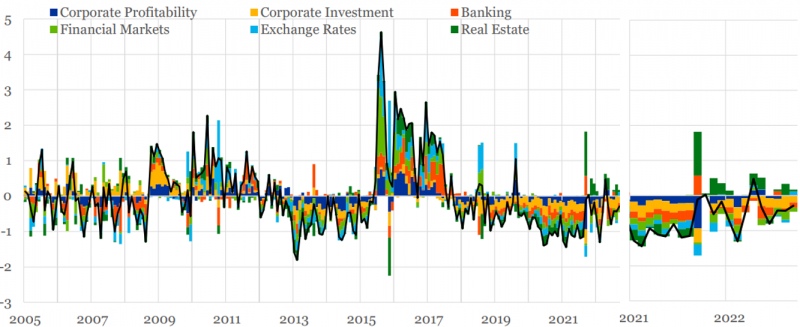
Having constructed the financial risk indicator as the sum of sector specific indices, our approach allows us to decompose the index into the contribution of each single topic. This alludes to the main reasons contributing to an increase in financial risk in the Chinese economy, enabling the tracking of specific sources of risk over time. Figure 2 shows that given the limited exposures of the Chinese financial sector to the subprime mortgage market and the domestic credit focus of China’s financial system, the stress experienced during the GFC is relatively contained and broadly balanced across sectors. However, during 2015-6, China’s financial sector experienced higher stress with corporate bond defaults, a sharp drop in the stock market, and a RMB sell-off. Consistently, our indicator main drivers in this period are “financial markets” and “exchange rates”.  Interestingly, we observe other increases in financial risks picked up by our measure such as the collapse of Baoshang in 2019. Finally, zooming in on the last two years, the increase in the index appears to be substantially due to an increase in risk in the residential sector.
Figure 2: Financial risk index: Decomposition 
 width=
Source: Authors’ calculations.
Notes: Time coverage 2005M01-2022M09. The series are scaled monthly by the total number of articles related to China published by the newspapers considered. 
As standard in the literature on risk and uncertainty (e.g., Baker et al., 2016), we explore the relationship between our overall financial risk indicator and various macro and financial variables using a structural vector autoregression (SVAR) framework and to overcome possible “overfitting” issues we employ Bayesian estimation techniques. For the baseline specification we include the following set of variables ordered from the most exogenous to the most endogenous: the natural logarithm of global industrial production exports to China, the natural logarithm of global oil prices, the emerging market sovereign spread (EMBI Global spread), the natural logarithm of the Chinese equity price index (CN equity index), our financial risk measure, the natural logarithm of the Chinese industrial production index, the natural logarithm of the Chinese consumer price index (CPI), and the Chinese 7-day repo rate.
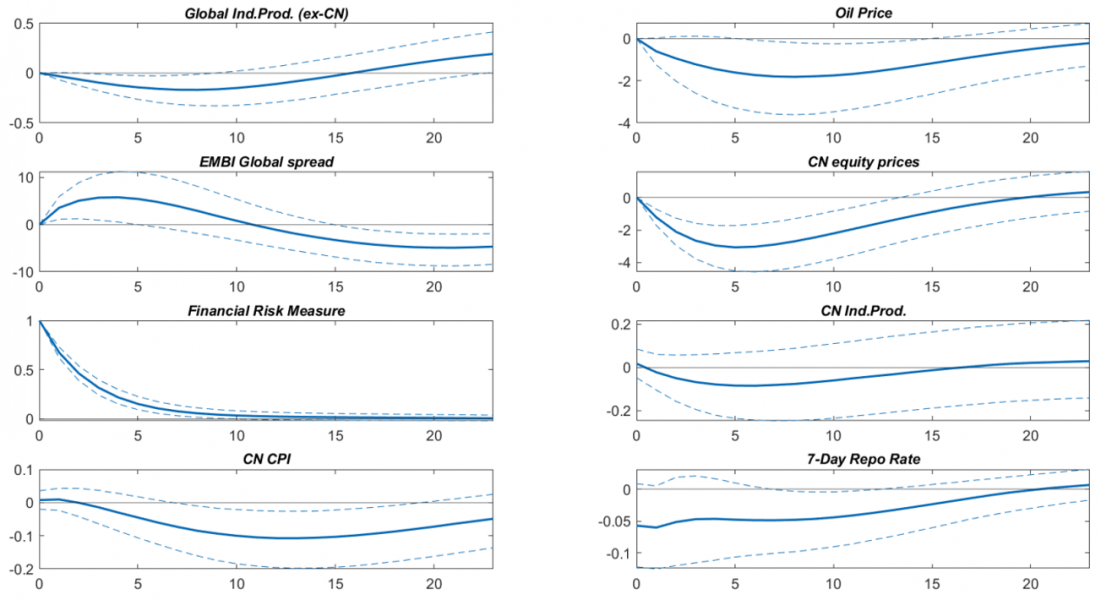
A shock to financial risk is identified with a recursive identification procedure obtained by using a Cholesky decomposition of the covariance matrix of the VAR reduced-form residuals. In doing so, we place the global variables at the beginning of the VAR given their more exogenous nature. Overall, we observe a negative and statistically significant impact on global industrial production excluding China and in line with the contraction in global activity, and potentially lower demand from China, oil prices decline by around 2pp in response to the shock to financial risk. The EMBI spread instead, increases by around 7bps, suggesting a tightening in financial conditions in emerging markets, while China’s equity prices decline by around 3pp after around 4 to 6 months before returning to previous levels after around a year. The decline in the consumer price index in China is consistent with an effect of heightened financial risk akin to that of a negative demand shock. Consistently, we observe a downward movement in China’s repo rate in response to the shock, pointing to a loosening of monetary policy to counteract the increase in financial risks.
Figure 3: Impulse-response functions of macro-financial variables to shocks in the overall financial risk indicator
 width=
Source: Authors’ calculations.
Notes: IRFs report percentage changes for all variables excluding EMBI Global spreads and the 7-day repo rate which are reported in bps. Dotted lines report the 68% credibility interval.
Lacking an objective reliable strategy to construct a financial risk index, in this section (presented in more detail in the original paper) we present the results from adopting alternative approaches. Specifically, we construct three alternative indicators. The first one is based on principal component analysis (PCA), while the second and the third make use of regression analysis. The alternative indices constructed using regression analysis produce qualitative similar IRFs compared to shocks to our core index, although with a rather smaller magnitude, while the PCA indicator responses are in general less significative and in some instances (EMBI Global spread, oil prices, CPI) qualitatively different from the other indicators.
Overall, we presented a model-based bottom-up approach to estimate an indicator of overall financial risk in China together with its constituent sub-components. To construct the indicator, we apply an unsupervised machine learning algorithm on a large number of newspaper articles reporting on financial risk in China published since 2005. This strategy has the benefit of endogenously extracting individual financial risk components while at the same time assessing their weight and impact on the overall financial risk indicator. We find that our core measure of financial risk correlates with other indicators of risk used for the Chinese economy and that the indicator captures financial risk episodes in China and does so in a timely fashion.

References

Baker, S., Bloom, N., and Davis, S.J. (2016), “Measuring economic policy uncertainty”, The Quarterly Journal of Economics Vol. 131, pp. 1593–1636.
Blei, D.M., Ng, A.Y., and Jordan, M.I. (2003), “Latent dirichlet allocation”, Journal of Machine Learning Research Vol. 3, pp. 993–1022.
Mikolov, T., Chen, K., Corrado, G., and Dean, J. (2013), “Efficient estimation of word representations in vector space”, mimeo.

About the authors

Alexander Al-Haschimi

Alexander Al-Haschimi is a team lead economist at the European Central Bank. He holds a BA and an MPhil degree in Economics from Columbia University and the University of Oxford, respectively, and conducted his PhD studies in economics at the University of Cambridge. Before the European Central Bank he worked as an assistant economist at the Federal Reserve Bank of New York.

Apostolos Apostolou

Apostolos Apostolou is an economist at the International Monetary Fund. He has previously worked at the European Central Bank, the World Bank, and the private financial sector. His research focuses on international macroeconomics, monetary policy, and climate-related financial risks. He holds a PhD from the Graduate Institute in Geneva, an MSc from the University of Warwick, and a BA from the University of California Los Angeles.

Andres Azqueta-Gavaldon

Andres Azqueta-Gavaldon is a machine learning researcher in Arcturis Data an AI medical start up based in Oxford.  He conducts research on drug discovery, clinical optimization, and novel machine learning algorithms on real world data. Before, he worked at the European Central Bank where he conducted research on using Natural Language Processing (NLP) techniques to model a wide range of uncertainty/risk indicators and to measure their effect on the real economy. He holds a PhD from the University of Glasgow and an MSc from the Ludwig Maximilian University in Munich.

Martino Ricci

Martino Ricci is a Senior Economist at the European Central Bank. His research focuses on international macroeconomics, international finance and the Chinese Economy. He holds a Ph.D. in Economics from the University of Milan, a Master degree in Economics from Roma Tre University and a Master degree in Economics and International Relations from the University of East Anglia.

More on these topics

Tags: