This policy brief should not be reported as representing the views of the Bank of Italy. The views expressed are those of the authors and do not necessarily reflect those of the Bank of Italy.
This study analyses the negative shock to Italy’s terms of trade (TOT) during the energy crisis in 2021-2022: the TOT deterioration was less pronounced than that recorded during the 1973-74 oil crisis, yet was particularly sharp. It was driven by energy goods and was greater than in the other euro-area economies due to a higher rise in energy import prices and to a greater share of energy products in total imports. The energy component was also the main driver both of the strong deterioration in the current account balance and of the large negative income effect of the TOT shock. At any rate, Italy has successfully weathered the storm: the gradual recovery in the terms of trade since 2022 has led to the return to a positive current account balance and to a positive income effect.
The COVID-19 pandemic and the subsequent economic rebound were a watershed for the world economy. After the pandemic-induced contraction in economic activity and muted prices in 2020, as of 2021 energy prices in particular began to rise in tandem with aggregate demand regaining momentum. The rise in natural gas prices was further triggered by the cuts in gas supplies from Russia and then, in February 2022, the Russian invasion of Ukraine led to further, exceptional price hikes as a result both of input shortages of strategic components produced in the war-zone and of the effects of the economic sanctions on Russia introduced by the international community.
These developments boosted euro-area countries’ import and export prices in a heterogeneous fashion according to their energy (especially natural gas) and strategic input dependence from abroad and led to exceptional negative terms-of-trade (TOT) shocks. The latter in turn affected both current account (CA) balances of the balance of payments and, ultimately, economic activity. We measure the recent negative TOT shock for Italy, for goods and for services, setting it both in a historical perspective and in an international comparison within the euro area. We also gauge its impact on the CA balance and estimate its income effect.
Based on national accounts (NA) deflators for Italy’s aggregate TOT and on foreign trade average unit value (AUV) for the goods TOT (due to the unavailability of sufficiently long time series for NA goods deflators), the two TOT series have moved hand in hand since 1961 (Fig. 1, left-hand side panel). The 2021-22 fall was more contained than that observed during the oil shock in 1973-74, but still very pronounced.
Turning to more recent quarterly NA data, after the temporary positive blip during the first wave of the pandemic, Italy’s TOT began to rapidly deteriorate in the course of 2021 when energy prices started to rise and global supply bottlenecks began to kick in, reaching its lowest level in the third quarter of 2022, when its year-on-year decline peaked at nearly 12 percentage points (Fig. 1, right-hand side panel). Since then the TOT has improved; as already noted for the long run, the dynamics of the aggregate index reflected those in the goods TOT and were muted, albeit only partly, by the broad stability in the services TOT.
Figure 1: Italy’s terms of trade
(index 2015=100)
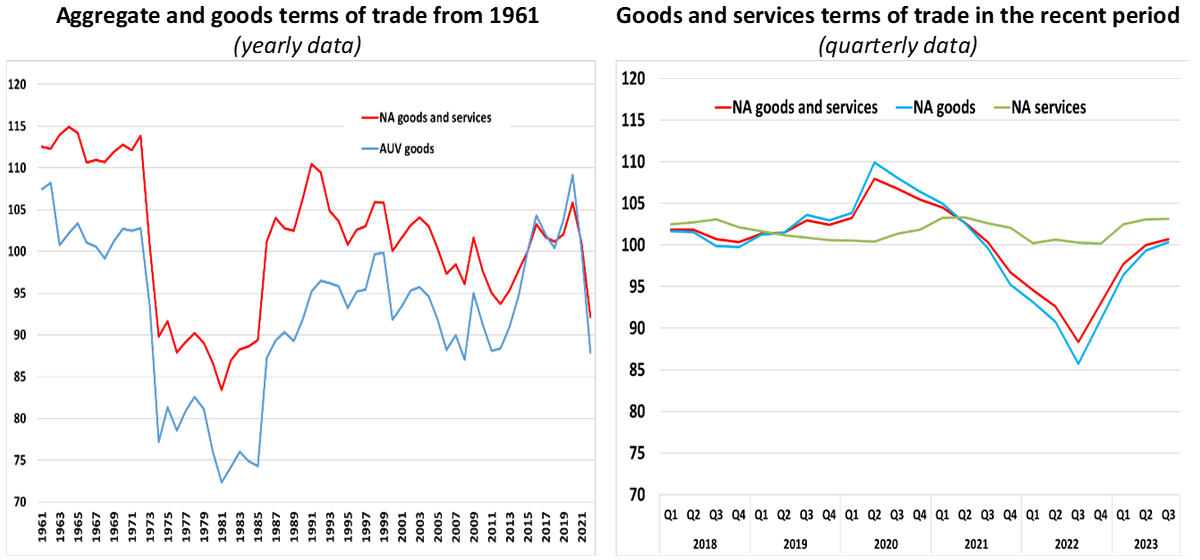 Source: Authors’ calculations on Istat-Ice foreign trade average unit value data (AUV), Istat annual national accounts (NA) and Baffigi (2015) for the left hand-side panel, and Istat quarterly national accounts (NA) for the right hand-side panel.
Comparing Italy’s goods TOT with that of its main euro-area peers in order to better quantify the relative shock to Italy, we observe that in the period between the third quarter of 2021 and the third quarter of 2022 the decline was significantly stronger in Italy than in the other three main euro-area economies (Fig. 2; left-hand side panel). This outcome was due both to a significantly higher rise in the goods import deflator in comparison with France and Germany (Fig. 2; right-hand side panel) and to low export deflator growth, similarly to these other two countries.1 In turn, Italy’s strong import deflator growth is largely explained by the significant increase in the country’s energy import AUV and by the significant weight of energy imports in the country’s overall goods imports.
Figure 2: Goods terms of trade and import deflators in the four main euro-area economies
(quarterly data; index 2015=100)
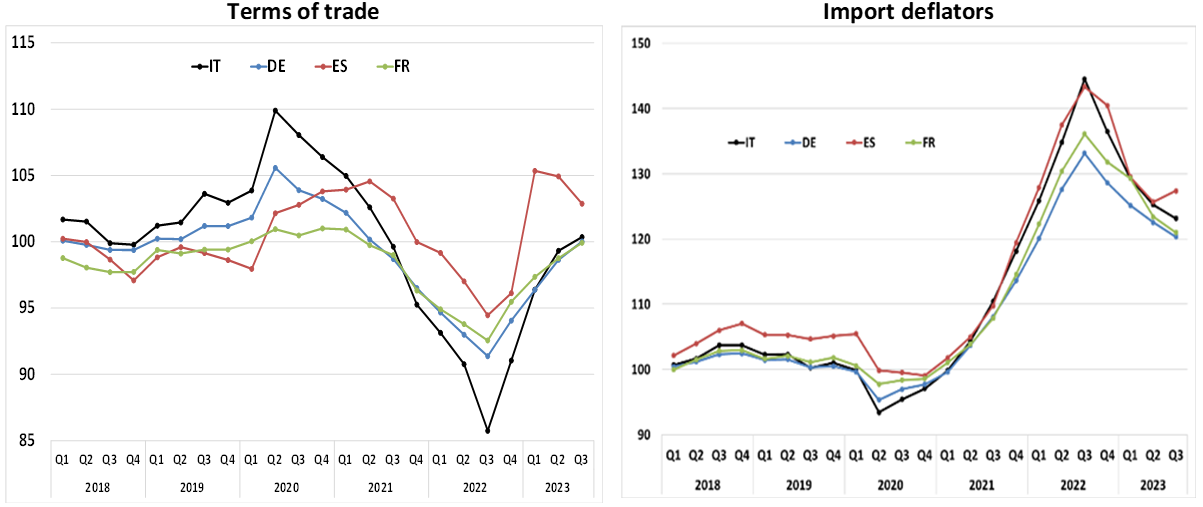 Source: Authors’ calculations on Istat and Eurostat quarterly national accounts.
After having pinpointed the main driver of the TOT deterioration in 2021-22 and of the subsequent improvement, we gauge some real effects of the TOT shock. In 2022, in line with the TOT decline, Italy’s CA balance worsened sharply and turned negative for the first time in a decade. The strong fall relative to 2021 was driven for nearly three quarters by the widening of the energy goods trade balance and only partly by the small reduction in the non-energy surplus, against a broad stability of the services deficit. In the other main euro-area economies the negative contribution of the energy deficit was lower. The correlation between the CA balance and the TOT is significant in Italy and, to a lesser extent, in Germany, whereas it is very low in France and Spain, possibly due to their larger services balance.
Since the end of 2022, the improvement in the TOT has hence gone hand in hand with an improvement in the CA balance especially in Italy and Germany, although with some volatility across quarters, also linked to seasonality patterns. By the third quarter of 2023 Italy’s CA balance had returned to positive values.
Following Gunella and Schuler (2022), we measure the income effect of the 2021-22 TOT shock in the four countries. The nominal income effect of the TOT is calculated by taking the difference between export and import deflator changes relative to the corresponding quarter of the previous year weighted by the previous year export and import values respectively, as a percentage share of nominal GDP. Given the availability only in value terms of foreign trade data, necessary for the decomposition by product, we focus on the nominal income effect; however, the estimated aggregate real income effect is similar (albeit slightly more muted) to the nominal one, with the country ranking remaining unchanged.
In the two years prior to the pandemic, the nominal income effect associated to movements in the aggregate TOT generally fluctuated between -1 and +1 percentage points of GDP in annualized terms (Fig. 3; left-hand side panel). By contrast, in the third quarter of 2022 Italy’s windfall loss peaked at an exceptional 4 percentage points, against about 2 and 3 points in France and Germany, respectively. The energy component accounted for most of the losses as of mid-2021 in all four economies, but was particularly large in Italy, where the non-energy goods and services component slightly mitigated the overall loss (Fig. 3; right-hand side panel).
Figure 3: The nominal income effect of the aggregate terms of trade shock
(seasonally unadjusted data; percentage points)
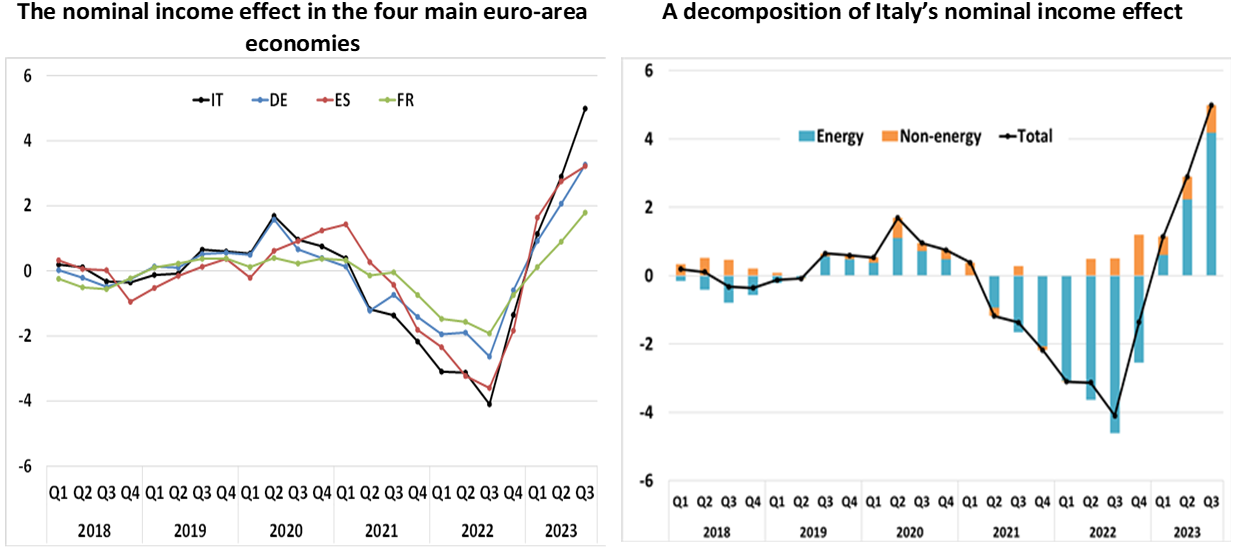 Source: Authors’ calculations on Istat and Eurostat quarterly national accounts.
Notes: The nominal income effect of the TOT is calculated by taking the difference between export and import deflator changes relative to the corresponding quarter of the previous year weighted by the previous year export and import values respectively, as a percentage share of nominal GDP. The energy component of the nominal income effect of the TOT is calculated by taking the difference between energy export and import average unit value changes relative to the corresponding quarter of the previous year weighted by the previous year energy export and import values respectively, as a share of nominal GDP; non-energy is computed as a residual.
By the first quarter of 2023 income losses had reverted back to gains in all countries, due to the energy component turning positive. The contribution of the non-energy component was also generally positive, with the exception of France. On average in the first three quarters of 2023 the positive income effect was well above 2019 values.
To conclude, although more contained than that recorded during the 1973-74 oil crisis, Italy’s 2021-22 TOT deterioration, driven by the goods component, was significantly pronounced. It was also stronger than the other main euro-area economies’ declines, owing in turn to the sharp rise in Italy’s import deflator, comparable only to that in Spain, where however export deflator growth was also very high, differently to Italy and to the other economies. Italy’s stronger import deflator growth can in turn be traced back to a higher rise in energy import prices and to a greater share of energy products in total imports. The energy component was also the main driver both of the strong deterioration in Italy’s CA balance and of the large negative income effect of the TOT shock. The improvement in the goods and aggregate TOT since the end of 2022, linked to the gradual decrease in energy prices, has gone hand in hand with an improvement in the CA balance; the income effect has turned positive and has fully offset the previous developments. Italy appears therefore to have successfully weathered the recent TOT storm.
Giordano, C. and E. Tosti (2024), “Weathering the storm: a characterization of the recent terms-of-trade shock in Italy”, Bank of Italy Occasional Papers No. 831.
Gunnella, V. and Schuler, T. (2022), “Implications of the terms-of-trade deterioration for real income and the current account” in ECB, Economic Bulletin, 3.
In Spain the goods import deflator increased only to a moderately lower extent than in Italy, but this development was offset by a comparatively large pass-through to export prices, in turn leading to the limited fall in this country’s goods TOT.