Inflation has experience large swings during the post-war period, oscillating between poles of double-digits rates in the 1970s and 1980s, and periods of low and stable rates following for example the Great Recession. Hidden behind these swings in headline inflation, however, have been significant changes in the distribution of inflation rates in disaggregated categories. We provide new theoretical and empirical insights into these changes. We analyze detailed U.S. Personal Consumption Expenditure Price Index (PCEPI) data and find that the cross-sectional distribution of disaggregated inflation rates has systematically changed between 1960 and 2021: First, extreme increases in inflation have become rarer, and extreme decreases have appeared. Second, inflation is granular, and importance of granularity has increased over time. Third, the ranking of headline inflation versus robust measures of inflation inverts several times in our data. Fourth, the covariance of inflation rates decreases more than the variance over time. These empirical findings provide important modeling guidance to policymakers suggesting that the inflationary process post-1990 has been driven by granular, idiosyncratic shocks rather than aggregate shocks.
A heterogeneous production model with idiosyncratic shocks is needed to match these facts. Using this framework provides new insights into the stabilization properties of monetary policy. In such a framework, the choice of policy regime interacts with the distribution of inflation rates and the choice of aggregate inflation measures. To demonstrate the importance of this interaction, we analyze the interaction of average inflation targeting (AIT), as well as a Taylor-type monetary policy rule, with a particular measure of aggregate inflation — core inflation — in a calibrated version of the model subject to an idiosyncratic shock in the oil producing sector. We find that in such a scenario targeting core inflation under a Taylor-type rule rather than headline inflation achieves much of the inflation stabilization gained from AIT. However, the stabilization gains of switching from a Taylor-type rule to AIT and focusing on core rather than headline inflation are additive. We show that such additive gains generally arise for an appropriately defined monetary policy regime in the face of any idiosyncratic shock.
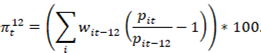
Our analysis begins by presenting new facts about the distribution of highly disaggregated inflation series that underlie the aggregate inflation process. As a basis for this analysis, we choose a consistent set of 183 disaggregated Personal Consumption Expenditure (PCE) inflation rates. These data go back to 1960 and cover 95% of the aggregate consumption basket. The headline PCE inflation rate is the primary series the Federal Reserve Open Market Committee uses to judge the rate of inflation. We calculate annual inflation as
First, our analysis shows that changes in the cross-sectional distribution appear quite evidently at the extremes: Extreme increases in inflation rates have become rarer, and extreme decreases have appeared over time. Before 1990 there were large positive shocks to inflation. The 99th and 90th percentiles experienced periods of very high inflation. The 1st and 10th percentile of inflation were fairly constant and rarely very negative. After about 1990 this pattern changed with the larger percentiles of the inflation distribution becoming smaller, particularly the 90th percentile. The 1st percentile of inflation saw large declines becoming negative.
Figure 1: Cross-Sectional Inflation Percentiles
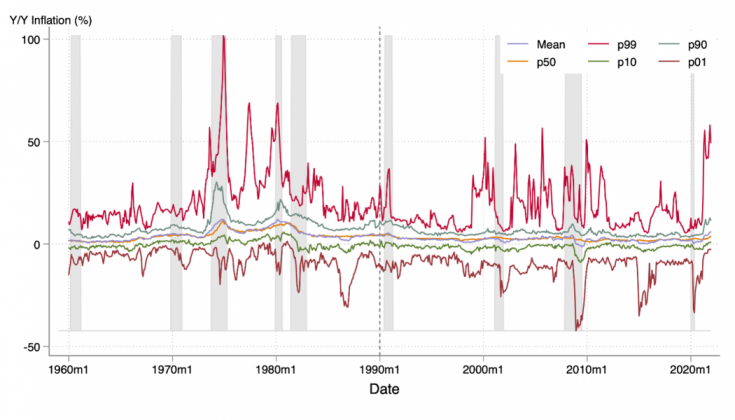
Notes: Each percentile X represent the year-over-year inflation rate in each month such that X percent of consumer spending is on goods with a weakly lower rate of inflation and 1-X percent of spending is on goods with a weakly higher rate of inflation. Shaded areas represent recessions as defined by the National Bureau of Economic Research (NBER). Authors’ calculation from PCEPI data.
Second, a few series have a disproportionately large impact on inflation: inflation is granular in the sense of Gabaix (2011). The top 10 of 183 personal consumption expenditure categories (PCE categories) accounted for 68 percent of PCE inflation in 2019. Fat tails which statistically encapsulate granularity characterize the distribution of category inflation rates, with fat tails on the positive side before 1990 and on the negative side after 1990, in line with the swings observed for the extremes of the distribution. Over time, granularity has increased. Tails of the distribution have not only become fatter, but the quantitative impact on headline inflation has also increased. We show this trend using a time-series decomposition into an equal-weighted component and a granular residual as in Forester et al. (2011) as
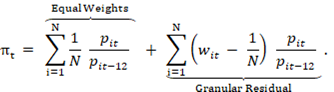
In the 1970s and 1980s, the equal-weighted component—which is large when aggregate shocks are important — was the dominant contributor to headline inflation. During the same period, the granular residual — which is large when a few observations are disproportionately influential — accounts for only 5 percent of aggregate inflation. However, between 1990 and 2019, its contribution rises to 36 percent, and to 62 percent in 2020-2021. This rise in importance suggests a heightened importance of idiosyncratic components to the inflationary process.
Finally, a systematic change in the variance- covariance structure complements the characterization of changes in the distribution of inflation rates over time: The covariance of disaggregated inflation rates has decreased more than the variance over time. These results follow from a decomposition of the variance in headline inflation into two components. The first is the variance of disaggregated inflation rates and the second is the covariance of inflation terms. We find that the covariance of disaggregated inflation rates has substantially declined over time and then exhibits a stable distribution for the last 30 years. While the overall variance has also declined, its decline has been less than the decline of the covariance. Taken together, these findings suggest that granular, idiosyncratic shocks have been playing an increasingly important role for the inflationary process over time, and for the readings of inflation from various aggregate measures.
Figure 2: Moving Average Variance and Covariance of Inflation Series
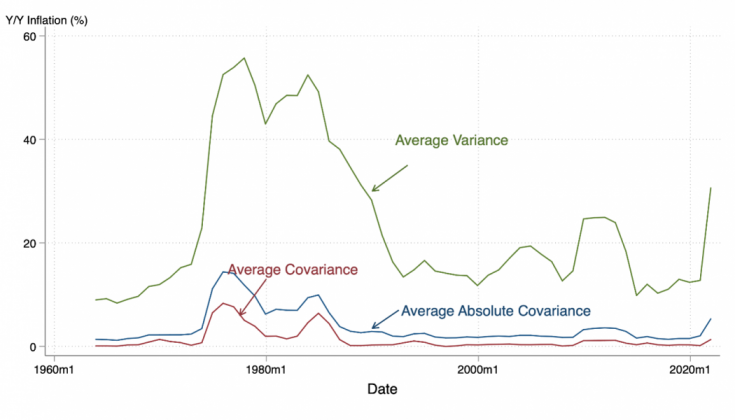
Notes: The numbers represent 60 month moving averages. The average variance is computed by calculating the variance of 12 month inflation rates for individual series and then averaging across series. Average covariance represents the covariance between each pair of inflation series. Average absolute covariance represents the average covariance if the absolute value of each pairwise covariance is taken before averaging. Authors’ calculations from PCEPI.
A heterogeneous production model with idiosyncratic shocks can rationalize these facts, while also providing new insights into the stabilization properties of monetary policy. We show these two results based on a model following Pasten et al. (2020). In this setup, sectors differ in size, the degree of price rigidity and input-output linkages. Sectors may be subject to idiosyncratic as well as an aggregate productivity shock. Monetary policy follows a Taylor-type monetary policy rule that targets headline inflation. We set the same parameters for the economy as in Pasten et al. (2020) and run two model exercises. The first exercise establishes that a model with idiosyncratic shocks is needed to match the four facts presented. The second exercise then shows how both the choice of monetary policy rule and measure of aggregate inflation can affect the distribution of inflation rates, and lead to different, but additive stabilization gains.
The first exercise establishes the need to use a heterogeneous, multi-sector model of the economy with idiosyncratic shocks to match the four facts presented. We analyze several different calibrations to arrive at this result. Each calibration represents a combination of an aggregate shock and/or idiosyncratic shocks that hit either one, all, or a subset of sectors. We find that only the inclusion of idiosyncratic shocks allows us to match all four facts. By contrast, there is no need to include aggregate shocks. In fact, aggregate shocks alone cannot replicate two facts, namely the fat tails in the distribution, and the larger drop in the covariance than the average variance. A direct implication of these exercises is that a conventional (one-sector) model with an aggregate shock cannot replicate the features of the inflationary process as in the data.
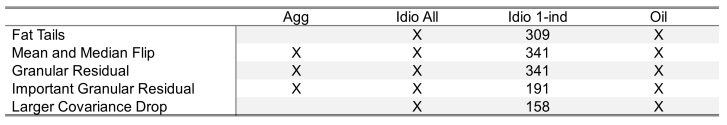
Notes: Each row represents a test which verifies if the model can reproduce one of the corresponding empirical facts. Columns represent different structures on the shocks in the model, “Agg only” denotes a calibration with an aggregate shock only, “Idio all” a calibration with 341 independent sectoral shocks, “Idio 1-ind” a set of 341 calibrations with one sector receiving a shock at a time, and “Oil” a common shock to the subset of oil-producing sectors. The fat tails test requires the 1st, 5th, 95th, and 99th percentiles to exceed what would be expected with a normal distribution. The granular residual test is passed if the sgranular residual is non-zero. It is considered important if the variance of the granular residual is at least 20 percent of the variance of headline inflation. The larger covariance drop test requires that as the size of shocks change the covariance should fall by more than variance.
The second exercise shows the importance of these insights for modeling the inflationary process and for the strategies monetary policymakers may pursue when they face a cycle driven by select idiosyncratic shocks. Building on a setup with idiosyncratic shocks, we show how both individually but also in combination two choices in particular affect the distribution of inflation rates and the stabilization of inflation through monetary policy. These choices concern the policy regime — a Taylor rule versus AIT — and the measure of aggregate inflation — headline versus core inflation. Our analysis in particular focuses on a shock to oil producing sectors. We find three results: First, AIT stabilizes the distribution more than a Taylor-type policy rule, especially by compressing the center of the distribution more. Moving from a Taylor-type rule to AIT reduces inflation volatility overall by about 50% while keeping inflation fluctuations stable. Second, we find that stabilization of core inflation — ignoring the shocks to the oil-producing sectors and only reacting to their complement — achieves most of the benefits for inflation stabilization as AIT, while leaving consumption volatility unchanged. The reason is that the focus on the complementary sectors embodies a muted, indirect reaction to the shocks from the sectors subject to shocks, emulating the smoothing properties of AIT. Third, stabilization of core inflation and shifting to an AIT regime creates additive inflation stabilization benefits.
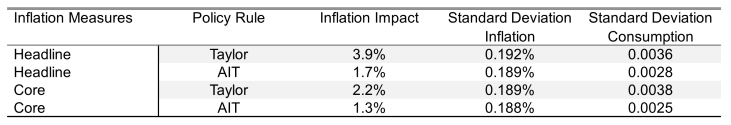
Notes: This table shows responses of inflation and consumption under various combinations of inflation measures and policy rules. The Taylor rule strictly targets inflation with a systematic response of 1.5 to the inflation measure, while AIT responds with the same coefficient to an equal weighted average of inflation and 6 of its lags.
Our analysis has shown that the cross-sectional distribution of disaggregated, PCE inflation rates has systematically changed between 1960 and 2021. A multi-sector heterogeneous production model with idiosyncratic shocks is needed to replicate the changes observed in the data. Moreover, in such a model, the monetary policy regime and measures of aggregate inflation interact through the distribution of inflation rates. In a particular application to an important idiosyncratic shock – to the oil-producing sector – we find that targeting core rather than headline inflation reduces inflation volatility and under AIT may create additive inflation stabilization benefits beyond AIT.