This paper applies the semi-structural model proposed by Bernanke and Blanchard (2023) to analyse wage growth, price inflation and inflation expectations in the euro area. The paper makes five main contributions. First, it estimates the model using quarterly data from the euro area from the first quarter of 1999. Second, it conducts an empirical assessment of how euro area price inflation responds to various exogenous shocks. This includes evaluating how shock transmission evolved during the pandemic and comparing it with experience in the United States. Third, the model decomposes the drivers of wage growth and price inflation in the post-pandemic period. It emphasises the transmission channels and the respective roles of supply and demand forces that have contributed to the recent inflationary surge. Notably, it identifies the impact of labour market tightness, productivity, global supply chain disruptions and energy and food price shocks. Fourth, the model generates conditional projections based on these exogenous shocks, enabling a more robust cross-check of inflation forecasts during times of significant global economic disturbances. Finally, the model’s application extends beyond the euro area: it has been applied by the Bank of Canada, the Bank of England and the Bank of Japan, providing a unified framework for analysing and comparing global inflation dynamics.
Inflation rose sharply in the aftermath of the Covid-19 pandemic in many advanced economies, including the euro area, in a context of exceptional macroeconomic volatility. Several factors may well have contributed: first, the public health response to the pandemic perturbated global supply chains, as global and idiosyncratic waves of infections and lockdowns severely disrupted production and trade networks in several parts of the world. At the same time, the fiscal and monetary policy responses supported aggregate demand. In many advanced economies, the pandemic shock was to a large extent absorbed by the government budget, through tax deferrals, public spending and investment, or job retentions schemes, somewhat shielding households from the shock, while central banks lowered policy rates and activated non-standard measures to further ease financing conditions. Households accumulated large savings pockets during the lockdowns, paving the way to an economic rebound and a tightening of the labour market once the pandemic was under control, despite the adverse supply shocks that ensued. While inflation was already elevated in the end of 2021, the price of energy and food increased dramatically after the Russian invasion of Ukraine in 2022.
Against this background, Bernanke and Blanchard (2023) introduced a semi-structural model of aggregate wage-price determination to investigate the factors behind the increase of inflation in the United States. The model contains four equations, which jointly determine nominal wages, prices and short- and long-run inflation expectations. The estimation strategy follows a hybrid approach that approximates a small theoretical model with a structural vector autoregression (SVAR) with added exogenous variables. The empirical model incorporates a flexible lag structure, to allow for richer dynamics and include measures of key shocks to product and labour markets, such as input shortages, energy and food prices, to account more explicitly for the forces affecting inflation.
The straightforward design of the model allows to replicate it for other economies, providing a common framework for analysing and comparing global inflation dynamics across the major world economic areas. Various central banks in advanced economies, including the Bank of Canada, the Bank of England, the Bank of Japan and the European Central Bank (as well as several national central banks in the Eurosystem), have done so.
In the paper “What caused euro area post-pandemic inflation?”, we apply the model to the euro area by estimating the parameters using quarterly euro area data. The estimation allows computing how wage and price inflation react to key labour and goods markets shocks and compare the euro area and the US within a common framework. We find that the responses of wage and price inflation to a tightening of the labour market (measured by a permanent shock to the vacancy-to-unemployment ratio) is less pronounced in the euro area, owing to a flatter wage Phillips curve and weaker wage-to-price pass-through. This implies that wages and prices in the euro area and the US economy respond quite differently to labour market shocks.
Moving to price shocks, we find that a temporary increase in global supply chain pressures (measured by a shock to the NY Fed Global Supply Chain Pressure Index1), a proxy for shortages, has more persistent effects on inflation in the euro area than in the US, likely reflecting the greater participation of euro area firms in global value chains. While the indicator was not a significant determinant of inflation prior to the pandemic, the model identifies these supply bottlenecks and shortages in production networks as a key driver of post-pandemic inflation in the euro area and the US. With respect to energy, we find similar transmission patterns in the euro area and the US to relative energy price shocks, and it seems that there has been no post-pandemic structural break. Nevertheless, the pass-through of energy prices to consumer price inflation during the 2022 energy crisis may have been slightly higher than suggested by historical regularities in the euro area2. Last, the response of consumer price inflation to a shock to the price of food is stronger on impact in the euro area than in the US but it reverts more quickly in the former, even turning negative after one year.
The estimated euro area model can be used to decompose the variation in any variable into its sources taking dynamic and general equilibrium effects fully into account. This includes the effects of the exogenous shocks hitting the euro area economy since the first quarter of 2020, as well as the effects of the initial conditions in 2020Q1, which capture the dynamic effects of pre-pandemic macroeconomic conditions.
Chart 1 decomposes the sources of annual nominal negotiated wage growth. According to the model, most the variability of euro area wage growth is explained by the catch-up effects to price shocks. In fact, as in the United States, price shocks (commodity prices and shortages) contributed to higher wage growth by raising short-term inflation expectations and triggering a process of real wage growth catch-up with unexpected inflation. The contribution of tight labour market conditions explained only part of the above-trend nominal wage growth between the first quarter of 2022 and the fourth quarter of 2023 in the euro area, adding up to 0.4 p.p to wage growth in 2023Q3. However, the model may fail to recognise that real wages might not have been able to catch up with past inflation had the labour market not tightened. Government measures introduced during the pandemic to protect workers and wages, such as job retention schemes, captured by the lockdown shocks, somewhat offset the negative contributions from subdued productivity growth. The contributions of the initial conditions are stable slightly above 2 percentage points per year.
Chart 1: Sources of nominal wage growth in the euro area
(year-on-year growth rate, from the first quarter of 2020 to the fourth quarter of 2023)
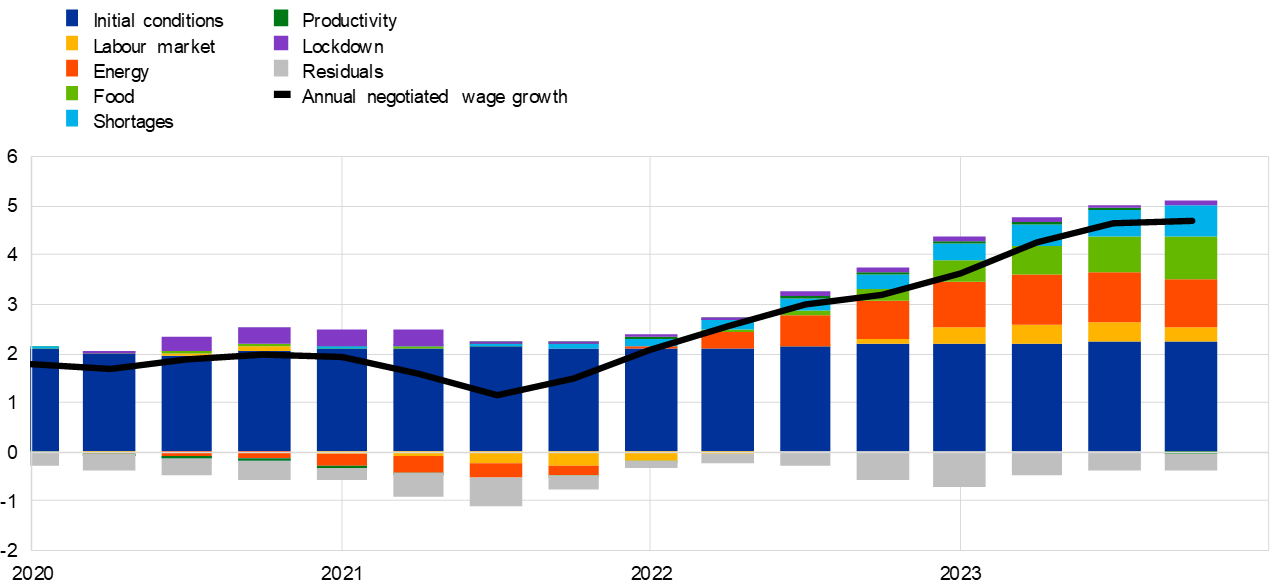 Notes: The figure shows a decomposition of the sources of annual negotiated wage growth between 2020Q1 and 2023Q4, based on the solution of the full model and the implied impulse response functions. The continuous line shows negotiated wage growth, and the total net heights of the bars are the model’s forecast of wage growth in each period, given initial conditions up to the fourth quarter of 2019. The contributions of the residuals are computed as the difference between actual and simulated data. The dark blue portion of each bar shows the contribution of pre-2020 data. The coloured segments of each bar show the general equilibrium, fully dynamic contribution of each exogenous variable to inflation in that period, as implied by the estimated model. Shocks to the rate of change of the relative price of energy and food are constructed as deviations of the values of those variables from zero. Shocks to the shortage variable are constructed as deviations of the values from the sample mean. Shocks to the vacancy-to-unemployment ratio variable are constructed as the actual value minus the value in the fourth quarter of 2019.
Chart 2 decomposes annual HICP inflation. According to the model, price inflation in the euro area was mainly driven by large positive contributions of energy prices shocks between 2021Q2 and 2023Q1, initially due to strong energy demand with the re-opening of the economy, but later inflation was led by adverse supply-side effects, including supply chain bottlenecks and other distortions sparked by the Russian invasion of Ukraine. The contribution of energy to price inflation peaked at 3.8 p.p. in 2022Q3. Unlike in the US, energy contributions remained significant until the end of 2022, passing through to other sectors of the economy, hence inflationary pressures were more persistent in the euro area. Food prices increased in the wake of the energy price shock and added up to 2.9 p.p. to HICP inflation at peak in 2023Q1. The combination of pent-up demand for goods and services, together the accumulation of nominal excess savings by households during lockdowns, and shortages for these goods due to supply chain disruptions, ushered additional inflationary pressures. While the contribution of shortages to US price inflation was relatively short-lived, we estimate that shortages affected price inflation more substantially and persistently in the euro area. The decompositions suggest that shortages added to inflation by up to 1.4 p.p. in the euro area, peaking in 2023Q1. Since then, the tight labour market conditions have contributed somewhat to higher inflation through their effects on wage growth. In the euro area, the small but increasing contributions from tight labour market conditions, up to 0.2 p.p., reflects the mild and delayed pass-through of the historically high vacancies-to-unemployed ratio to higher wages and prices. Last, the contributions of the initial conditions in the euro area were on average slightly below 2 p.p., suggesting that, absent the pandemic era shocks considered here, inflation would have likely remained below 2%, in line with the ECB inflation target of “below, but close to, 2%” prior to the 2021 Strategy Review.
Chart 2: Sources of price inflation in the euro area
(year-on-year growth rate, from the first quarter of 2020 to the fourth quarter of 2023)
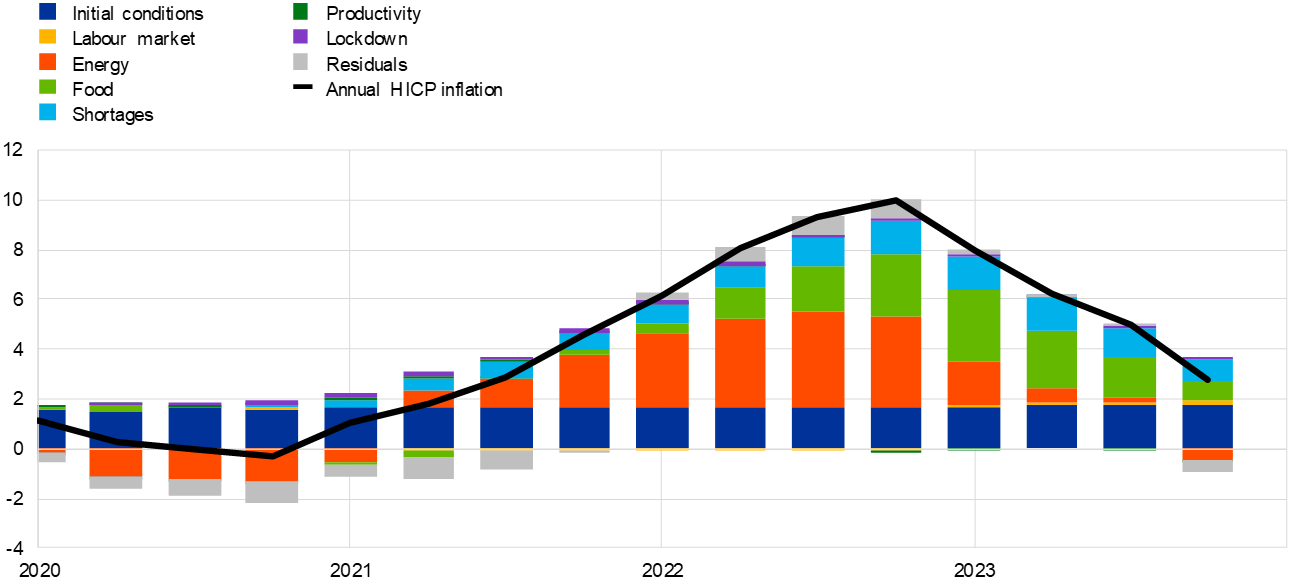 Notes: The figure shows a decomposition of the sources of annual HICP inflation between 2020Q1 and 2023Q4, based on the solution of the full model and the implied impulse response functions. The continuous line shows actual inflation, and the total net heights of the bars are the model’s forecast of inflation in each period, given initial conditions up to the fourth quarter of 2019. The contributions of the residuals are computed as the difference between actual and simulated data. The dark blue portion of each bar shows the contribution of pre-2020 data. The coloured segments of each bar show the general equilibrium, fully dynamic contribution of each exogenous variable to inflation in that period, as implied by the estimated model. Shocks to the rate of change of the relative price of energy and food are constructed as deviations in the values of those variables from zero. Shocks to the shortage variable are constructed as deviations in the values from the sample mean. Shocks to the vacancy-to-unemployment ratio variable are constructed as the actual value minus the value in the fourth quarter of 2019.
The model shows that the main drivers of inflation in the euro area have been supply-side shocks, with a more limited role for demand shocks as captured by labour market tightness, notwithstanding the supply-demand imbalances due to pent-up demand and supply chain disruptions. These pandemic-era shortages may have had a more persistent impact on euro area inflation than initially anticipated. The role of supply shocks in the euro area is larger than in the US, mostly due to its greater exposure to the idiosyncratic effects of the Russian invasion of Ukraine. Overall, the model is particularly well-suited to explaining the specific post-pandemic inflation dynamics and therefore provides a useful benchmark for cross-checking inflation forecasts. For example, at the current juncture, the model is a useful tool for assessing the potential impact of tensions in the Middle East and the Red Sea on inflation via its effect on global supply chains and energy commodities prices. However, the model may not be flexible enough to cope with future monetary policy challenges. The model specification could be improved for instance by adding:
These changes would help capture the general equilibrium and anticipated effects of policy shifts, in particular the role of the expectation channel for policy announcements.
Finally, the paper also explores the implications of integrating the pandemic period in the estimation sample for the model properties and conditional projections, shedding light on potential structural breaks and non-linearities during the pandemic period that could be relevant when re-estimating the main macroeconometric models of the euro area.
Angelini, E., Bokan, N., Christoffel, K., Ciccarelli, M. and Zimic, S. (2019), “Introducing ECB-BASE: The blueprint of the new ECB semi-structural model for the euro area’’, Working Paper Series, No 2315, ECB, Frankfurt am Main, September.
Arce, O. Ciccarelli, M., Kornprobst, A. and Montes-Galdon, C. (2024), “What caused the euro area post-pandemic inflation?”, Occasional Paper Series, No 343, ECB, Frankfurt am Main
Bańbura, M. and Bobeica, E. (2023), “Does the Phillips curve help to forecast euro area inflation?”, International Journal of Forecasting, Vol. 39, No 1, pp. 364-390
Baqaee, D. and Farhi, E. (2022), “Supply and Demand in Disaggregated Keynesian Economies with an Application to the COVID-19 Crisis”, American Economic Review, Vol. 112, No 5, pp. 1397-1436.
Bernanke, B. S. and Blanchard, O. J. (2023), “What Caused the US Pandemic-Era Inflation?”, Working Paper 31417, National Bureau of Economic Research, Cambridge MA.
Bobeica, E., Ciccarelli, M. and Vansteenkiste, I. (2019), “The link between labor cost and price inflation in the euro area”, Working Paper Series, No 2235, ECB, Frankfurt am Main, February.
Ciccarelli, M., Darracq Pariès, M., Landau, B. and Sousa, J. (2023), “Why we need models to make projections”, The ECB Blog, last accessed: 21.12.2023.
Ciccarelli, M. and Osbat, C. (2017), “Low inflation in the euro area: Causes and consequences”, Occasional Paper Series, No 181, ECB, Frankfurt am Main, January.
Darracq Pariès, M., Kilponen, J. and Notarpietro, A. (eds.) (2021), “Review of macroeconomic modelling in the Eurosystem: current practises and scope for improvement”, Occasional Paper Series, No 267, ECB, Frankfurt am Main, September.
De Santis, R. A. and Tornese, T. (2023), “Energy supply shocks’ nonlinearities on output and prices”, Working Paper Series, No 2834, ECB, Frankfurt, August.
ECB (2023), “Macroeconomic projections”, European Central Bank, last accessed: 09.01.2024.
ECB (2016), “A guide to the Eurosystem/ECB staff macroeconomic projection exercises”, European Central Bank, last accessed: 09.01.2024.
English, B, Forbes, K, and Ubide, A. (2024), “Monetary Policy Responses to the Post-Pandemic Inflation”, CEPR Press
Eser, F., Karadi, P., Lane, P., Moretti, L. and Osbat, C. (2020), “The Phillips Curve at the ECB”, Working Paper Series, No 2400, ECB, Frankfurt am Main, May.
Favero, C. A., Ichino, A. and Rustichini, A. (2020), “Restarting the economy while saving lives under Covid-19”, CEPR Discussion Paper No 14664, Centre for Economic Policy Research, London, April.
Ghomi, M., Hurtado, S. and Montero, J-M (2024), “Analysis of recent inflation dynamics in Spain. An approach based on the Blanchard and Bernanke (2023) model”, Occasional Papers. 2404.
Hale, T., Angrist, N., Goldszmidt, R., Kira, B., Petherick, A., Phillips, T., Webster, S., Cameron-Blake, E., Hallas, L., Majumdar, S. and Tatlow, H. (2021), “A global panel database of pandemic policies (Oxford Covid-19 Government Response Tracker)”, Nature Human Behaviour, Vol. 5, pp. 529-538.
Haskel, J., Martin, J., and Brandt, L. (2023), “Recent UK inflation: an application of the Bernanke-Blanchard model”
Nakamura, K., Nakano, S., Osada, M., and Yamamoto, H. (2024), “What Caused the Pandemic Era Inflation?: Application of the Blanchard-Bernanke Model to Japan”, Bank of Japan Working Paper Series 24-E-1, Bank of Japan.
Nickel, C., Bobeica, E., Koester, G., Lis, E. and Porqueddu, M. (2019), “Understanding low wage growth in the euro area and European countries”, Occasional Paper Series, No 232, ECB, Frankfurt am Main, September.
See https://www.newyorkfed.org/research/policy/gscpi#/overview.
The sum of the coefficients relating price inflation to relative energy inflation and the impulse response of price inflation to change in energy prices are estimated to be higher when introducing data from the post-pandemic period.